Operation
Teqwave H
62
Hauser
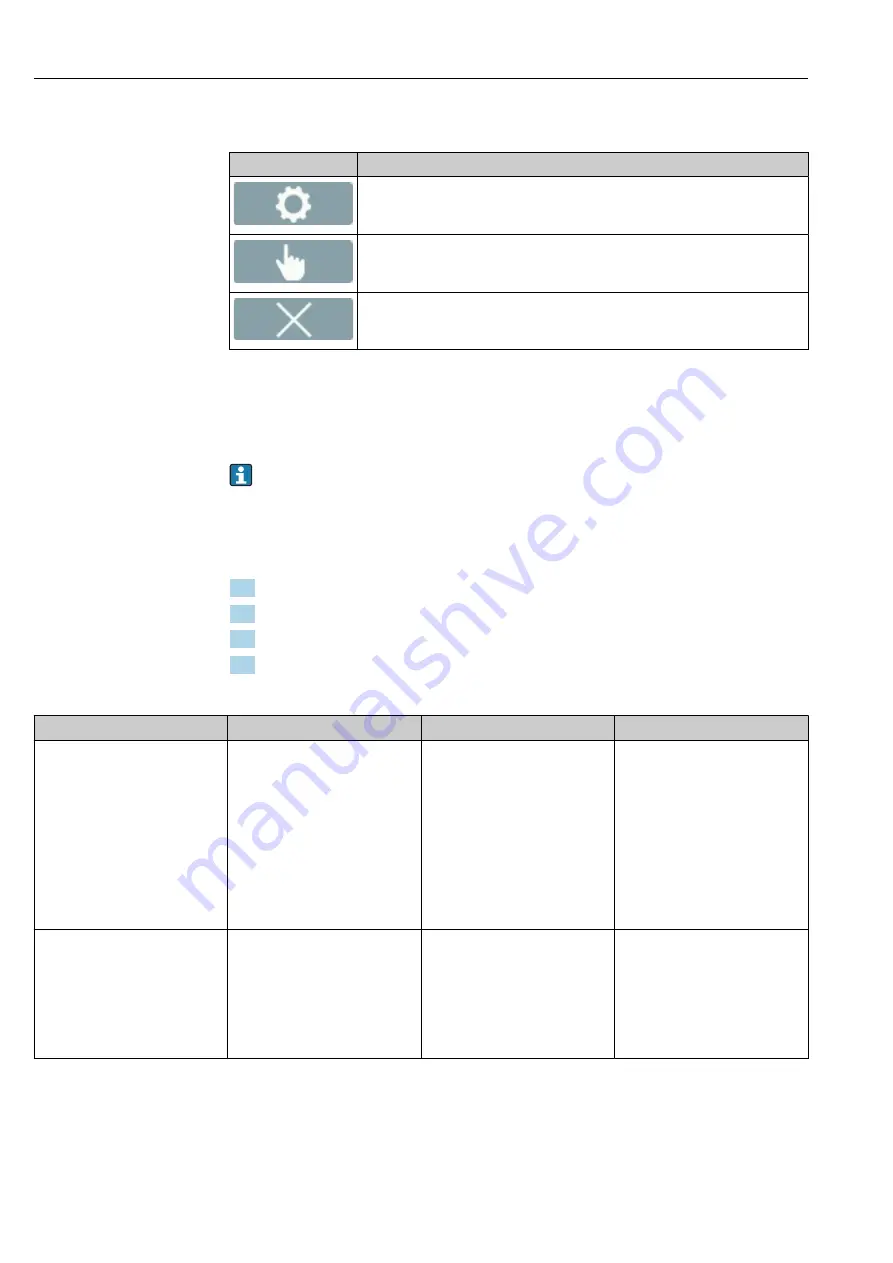
11.3.2 Graph tools
Button
Description
Settings
Navigate to the graph settings.
Cursor position
Select the cursor position in the graph for the desired measured value display.
Delete
Clears the graph. The graph representation then resumes.
11.4 Reading measured values via the operating tool
The Viewer presents the measured data in graph and text form on the start screen. The
Live Viewer
mode is automatically activated once the transmitter is connected.
Following an offline analysis of the data, the "Teqwave Viewer" → "Live Viewer" menu
allows users to switch to the Live View.
11.4.1 Adjusting the graph display format
Navigation Viewer
1. Menu "Teqwave Viewer" → "Graph settings" → "Y-axis 1"
2. Menu "Teqwave Viewer" → "Graph settings" → "Y-axis 2"
3. Menu "Teqwave Viewer" → "Graph settings" → "Time axis"
4. Menu "Teqwave Viewer" → "Graph settings" → "Time interval in s"
Parameter overview with brief description
Parameters
Procedure
Selection/input
Factory setting
Time axis
Select the period shown on the X-
axis.
• 1 minute
• 3 minutes
• 5 minutes
• 10 minutes
• 30 minutes
• 1 hour
• 6 hours
• 12 hours
• 1 day
• 7 days
• 30 days
• 90 days
5 minutes
Y-axis 1
Select measured variables to be
displayed on the left-side axis.
Depends on the measured variables
enabled and the selected
concentration app:
• Analysis parameter 1…n
• Temperature
• Speed of sound
• Density
• Dispersion
Analysis parameter 1
Содержание Teqwave H
Страница 93: ......
Страница 94: ......
Страница 95: ......
Страница 96: ...www addresses endress com 71510161 71510161 ...


