


1592028000 XWEB300D_500_500D opr GB r2.2.0 2013.08.01.docx XWEB500/300 87/114
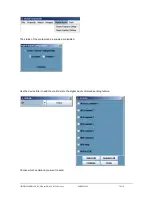
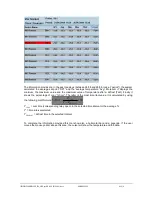
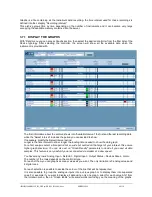
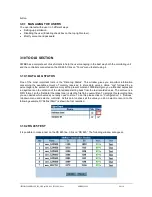
On the other side if you want to display the values in different graphs, you have to chose AG1 for the first
values, AG2 for the second and AG3 for the third.
Remember that each graph can be renamed by the user with an appropriate name into the
corresponding “Graph Labels” situated into the low side of the page.
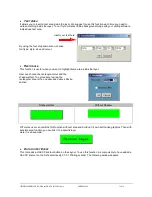
Before clicking the command “View” it is possible to define the graph density to decide the resolution of
the lines and recordings. Select the box “ Graph Density”.
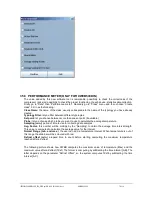
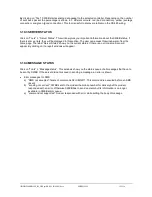
Higher is the value of this parameter better will be the graph resolution, but longer the downloading time
from the XWEB.
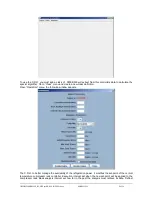
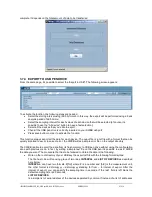
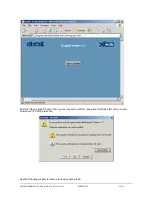
Now Click on “View” to start the transferring process of data from the XWEB to your PC.
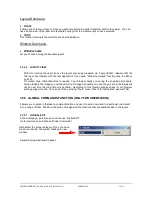
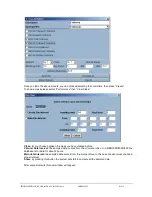
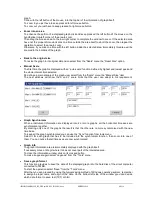
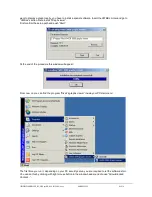
The displaying structure is based on a Java Applet and the Java Virtual Machine program installed into
the remote PC that computes the data coming from the XWEB.
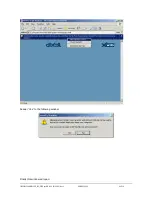
Depending on the Virtual Machine version installed a message to accept the term of use will appear
during the operation.
Dixell S.r.l.. guarantees that the software is free from viruses and the request can be accepted.
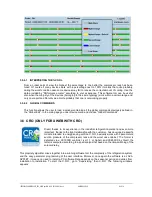
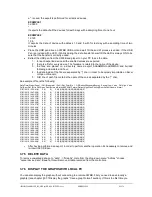
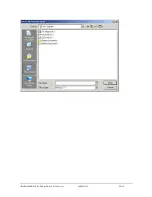
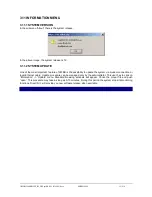
The counter signals shows the status of the data you are
downloading
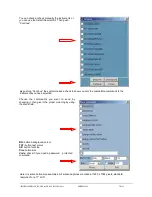
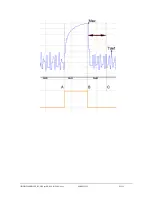
At the end you will see the graph.
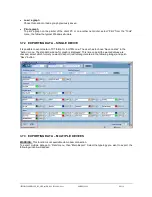
Zoom in/out procedures
Before executing the zoom it is necessary, if there is more than a graph displayed, to select the desired
Содержание Dixell XWEB300
Страница 1: ...OPERATION MANUAL v 2 2 0 ...
Страница 2: ...1592028000 XWEB300D_500_500D opr GB r2 2 0 2013 08 01 docx XWEB500 300 2 114 ...
Страница 80: ...1592028000 XWEB300D_500_500D opr GB r2 2 0 2013 08 01 docx XWEB500 300 80 114 ...
Страница 96: ...1592028000 XWEB300D_500_500D opr GB r2 2 0 2013 08 01 docx XWEB500 300 96 114 ...


