EZ S
ta
t™
U
ser
’s & I
nstalla
tion M
anual
19
3.8.2
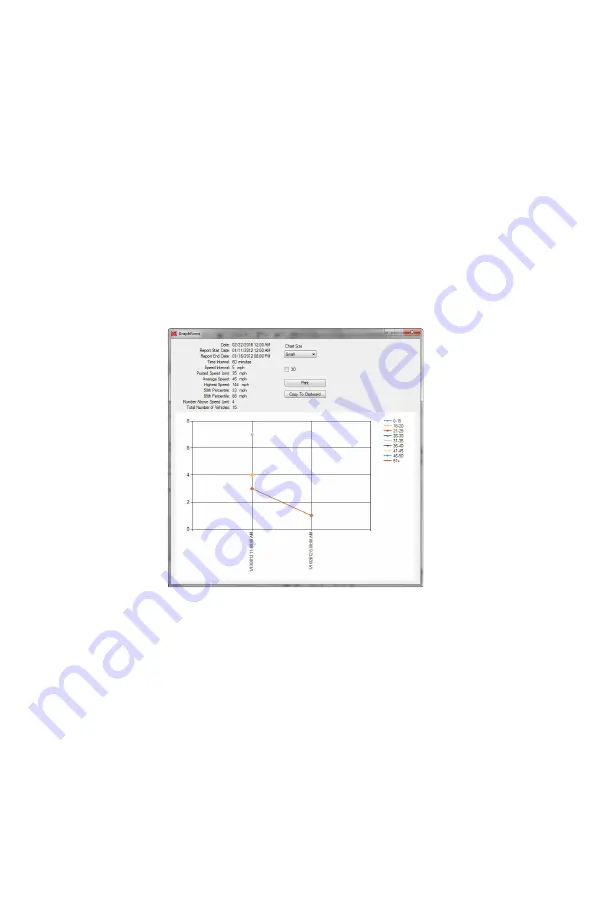
Count vs. Time
(Line Graph)
Shows the number of vehicles passing the logger at a particular
time, grouped by their speed . This graph is more suitable for fewer
speed ranges and smaller date ranges . We recommend setting your
Time Interval to 24 hours if using this to graph for more than one
day .
•
GRAPH
: Generates the graph .
•
3D
: If checked the graphs shows 3-D lines .
Figure 3.8.2
Count vs . Time .
Содержание EZ Stat
Страница 1: ...EZStat Version 3 User s Manual Installation Guide Rev 5 2 19 ...
Страница 2: ......
Страница 3: ...EZStat Version 3 User s Manual ...
Страница 33: ...EZ Stat User s Installation Manual 33 User Notes ...
Страница 34: ......
Страница 35: ......
Страница 36: ...www DecaturElectronics com 1 800 428 4315 ...


