DM DOC 040 Rev 1.0
ECG Interpretation general description
Healthcare Professional’s Responsibility
The interpretations provided by D-MAS are for the exclusive use of licensed physicians or
personnel under their direct supervision. The suggested interpretation, including
numerical and graphical results, should be examined with respect to the patient’s overall
clinical condition. It is the responsibility of the Healthcare Professional to ensure proper
administration of the test, making a diagnosis, obtaining expert opinions on the results,
and instituting the correct treatment.
Overall P onset, P offset, QRS onset,
QRS offset and T termination are
determined from all 12 leads. Individual
lead wave amplitudes are then
obtained.
P+, P-, Q, R, S, R’, S’, T+ and T-
amplitudes are measured with respect
to a horizontal line through the lead
QRS onset.
Durations are measured between relevant points.
Areas are measured in units of millivolts x milliseconds (mV x ms). Units of measure are not
specified when an area measurement appears in the criteria.
Isoelectric components between the overall QRS onset and an individual lead onset are not
included in a Q or R duration.
The minimum wave acceptable has to have a duration >8 ms and an amplitude >20
V.
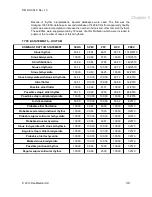
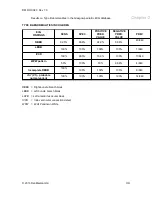
Stability of the measurements in the presence of noise - IEC Measurement Accuracy -
changes of measurements cause by NOISE on ECGs:
Global
Measurement
Type of added
NOISE
Disclosed differences
Mean (ms)
Standard
deviation (ms)
P Duration
P Duration
P Duration
P Duration
QRS Duration
QRS Duration
QRS Duration
QRS Duration
QT Interval
QT Interval
QT Interval
QT Interval
High frequency
Line frequency (50Hz)
Line frequency (60Hz)
Base-line
High frequency
Line frequency (50Hz)
Line frequency (60Hz)
Base-line
High frequency
Line frequency (50Hz)
Line frequency (60Hz)
Base-line
0.600
-0.400
0.000
-0.400
0.600
0.600
-0.400
0.200
-2.200
-0.200
-0.200
-0.800
2.503
1.265
2.494
1.265
3.534
2.836
2.797
3.048
3.048
0.632
1.476
1.398
© 2013 DanMedical Ltd
24

