


20
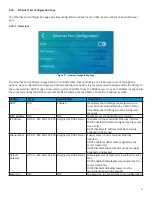
5.6.2 Overview
③
①
④
②
⑤
⑥
⑦
⑧
Figure 22 - Historical Trend Page
Item # Item
Description
1
Graphing Window
Area of the page where variables are plotted
2
Legend
List of variables and their values at the cursor timestamp that are plotted in the graph
-
ing window
3
Show/Hide Legend
Expands the graphing window and hides the legend
4
Graphing Duration
Displays menu with the following selectable options for the range of the x-axis: 1 min, 5
min, 10 min, 30 min, 1 hour, 2 hours, 4 hours, 8 hours, 12 hours, 1 day, 2 days, 5 days,
1 week, 2 weeks, 4 weeks
5
Refresh
Reset line graph and variable visibility
6
Show/Hide Cursor
Toggle visibility of cursor
7
Cursor Position
Adjusts position of the cursor
8
Cursor & Timestamp Cursor represents the position of the time stamp in the graphing window
5.6.3 Graphing Window
When the historical trend page loads, the historical line plots for each variable populate the graphing window. The
current time is shown in the bottom right corner and serves as the ending point of the historical trend. As new trend
intervals are recorded, the graphing window is updated. To reset the limits of the graphing window to the current time
and original range, tap the refresh icon.
To change the default graph duration of 1 hour, tap the graph duration icon and select a new duration from the scrollable
list.
5.6.4 Cursor and Timestamp
Tap the show/hide cursor icon to toggle the visibility of the cursor and timestamp. The values of the variables displayed
in the legend correspond to the timestamp shown below the graphing window. Tap the cursor position arrows to move
the cursor. As the cursor moves, the timestamp and variable values are updated.