


18
5.5
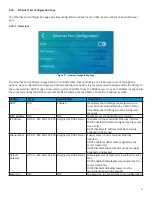
Live Trend Page
The live trend page is intended for temporary monitoring of the iLINQ controller’s operation and space conditions. The
live trend page generates a line graph of the following variables:
•
Space Temperature
•
Space Humidity
•
Cooling Setpoint
•
Heating Setpoint
•
Supply Temperature
5.5.1 Overview
③
①
④
②
⑤
⑦
⑥
Figure 20 - Live Trend Page
Item #
Item
Description
1
Graphing Window
Area of the page where the variables are plotted
2
Legend
List of variables and their current values that are plotted in the graphing window
3
Show/Hide Legend
Expands the graphing window and hides the legend
4
Graph Duration
Displays menu with the following selectable options for the range of the X-axis: 1
min, 5 min, 10 min
5
Refresh
Reset line graph and variable visibility
6
Historical Trend
Link to historical trend page
7
Page Navigation Tabs Shows active page and provides navigation to other pages
5.5.2 Graphing Window
When the live trend page loads, the line plots for each variable begin. The current time is shown in the bottom left
corner and serves as the starting point of the live trend. As time accumulates, the line plots continue until they fill the
graphing window. To view line plots beyond the limits of the graphing window, press and drag in the area of graphing
window. To reset the limits of the graphing window to the current time and original range, tap the refresh icon.