


24
DEBUG
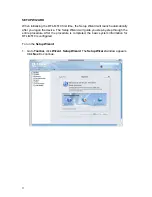
Go to the
Toolbar
, click
Tools
,
Debug
. The
Debug
window appears, see below.
The Debug tool is a trouble shooting tool for your hardware provider. When you
encounter hardware problems or configuration problems of DFL-M510, you can
retrieve the debug information from the DFL-M510, and provide this file to your vendor
for further analysis.
Содержание DFL-M510
Страница 2: ......
Страница 6: ...iv ...
Страница 60: ...51 When the settings are processed the following screen appears 5 Click OK to finish ...
Страница 63: ...54 PARAMETER TAB Click the Parameter tab The following screen appears This tab defines management parameters ...
Страница 80: ...71 3 Enter a file name and click Save 4 Click OK to confirm the export 5 Click OK to continue ...
Страница 95: ...86 5 Under Group Host select PM and click Apply ...
Страница 99: ...90 3 Input a pattern named Streaming 1 with category Streaming Media and TCP port 3001 4 Click Save ...
Страница 101: ...92 3 Input a rule name Web Chat 1 with category Web Control and servers 140 126 21 4 4 Click Save ...
Страница 104: ...95 2 Under Popup Message to User click Add 3 Type a description and the content of the message and click OK ...


