58
59
TECHNICAL INFORMATION
C
ONTOUR
®
N
EXT
ONE blood glucose monitoring system
User Accuracy Radar Plot
5%
1.7
mmol/L
1.4
mmol/L
>1.9
mmol/L
10%
25%
30% >35%
20%
15%
1.1
mmol/L
0.8
mmol/L
0.6
mmol/L
0.3
mmol/L
11
.1
16
.1
20.0
23.7
27.8
3
3.3
27
.8
23.7
20.0
1
6.1
11.
1
5
.6
0.
8
5
.6
%
5%
%
1.7
7
mmmol/L
1.4
mmo
l/L
m
>1.9
9
mmo
l/L
%
10
%
0
25
%
5
330%
0
5%
>3
5
5
%
20
0%
%
0
%
%
%
%
%
%
%
%
15
5
5
5
5
5
5%
1.1
m
mmol/L
m
0.88
8
8
m
m
m
mm
mo
m
l/L
m
0.
.6
mmo
l/L
m
0.3
mmmol/L
m
11
.1
16.1
20.0
23.7
27.8
33
.3
27
.8
23.7
20.0
16.
1
11.
1
5.
6
0.
8
5.
6
YS
I
®
(m
mo
l/L
)
+
–
All samples (n = 329)
15-15 Zone (0.8 mmol/L or 15%)
0.6 mmol/L or 10%
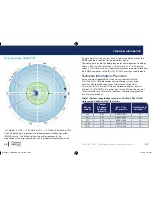
The 329 data points represent the blood glucose monitoring system
(BGMS) results. The distance from the center represents the
magnitude of the error compared with the laboratory reference result.
If a data point is at the center, there is zero error, which means the
BGMS reading is identical to the laboratory value.
The data points inside the bold green outer circle represent readings
within ± 0.83 mmol/L for values < 5.55 mmol/L or ± 15% error for
values ≥ 5.55 mmol/L versus laboratory reference to demonstrate how
the BGMS compares to the ISO 15197:2013 accuracy requirements.
Technical Information: Precision
A measurement repeatability study was conducted with the
C
ONTOUR
N
EXT
ONE blood glucose monitoring system using
5 venous whole blood specimens with glucose levels from
2.4 mmol/L to 18.5 mmol/L. With each blood specimen, each of
3 lots of C
ONTOUR
N
EXT
test strips was tested 10 times on each of
10 instruments for a total of 300 readings. The following precision
results were obtained.
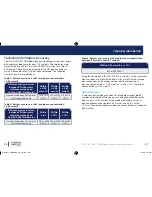
Table 1: System repeatability results for
C
ONTOUR
N
EXT
ONE
meter using
C
ONTOUR
N
EXT
test strips
Mean,
mmol/L
Pooled
Standard
Deviation,
mmol/L
95% CI of
SD, mmol/L
Coefficient of
Variation, %
2.43
0.05
0.046–0.055
2.1
4.31
0.07
0.063–0.075
1.6
7.17
0.10
0.090–0.106
1.4
11.39
0.16
0.147–0.174
1.4
18.41
0.22
0.201–0.238
1.2
85096877_CntrNxtONE_UG_EN.indd 58-59
9/21/16 3:47 AM

