15
Footprint Dashboard
Help Guide
Reporting
Administrator/Supervisor Level
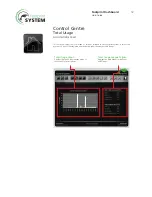
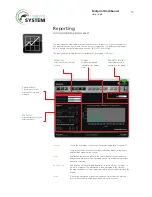
Statistics
Covers the total usage of all energy that day including kWh, cost, and Co
2
.
These same statistics are then showing for the three highest using Zones,
and the three highest using Groups.
Graph
Displays the energy used (kWh) in the current day. This allows the user to
understand when units are being turned on and see at what time possible
peaks are occurring,
Unit Selection
Unit selection allows the Admin/Supervisor to select 3 Zones, 3 Groups, or
3 Units to compare. This information is then presented in the statistics
showing the highest to lowest performers while also being illustrated on the
Graph.
Period
To have the information presented for different time scales, the user can
select to have this as a single day, a week, a month, or a year.
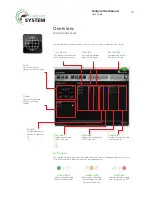
Selection
Select from Zones, Groups
or Units.
Graph
Displays the selected
information for energy
used.
Period Selection
Select what period to
generate on the graph.
Comparison
Choose up to three
selections to compare
statistics.
Statistics
Lists the statistics for the
selected factors.
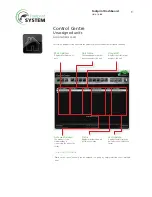
The reporting page allows Administrators and Supervisors to report on Zones/Groups/Units for
any given time period up to a year. This can be set to compare up to 3 different zones/groups/
units to analyse their performance and export as PDF or CSV if necessary.
The reporting page initially lays out the current day’s total usage of all zones.
Содержание bs6396
Страница 1: ...Dashboard User Guide Version 1 7...

