26
CM7015
7. History Graph
The History Graph can be used to track changes in various weather parameters over
time. While on the home screen, press the
HISTORY
key to toggle between the different
graphs. Keep pressing the
HISTORY
key to toggle between the five available graphs
at any time. When selected, the name of the parameter shown by each graph will be
displayed briefly at the top of the screen, along with the relevant icon shown in the
Graph Display Box. This icon will be displayed at all times, so it’s simple to tell which
graph is currently being displayed.
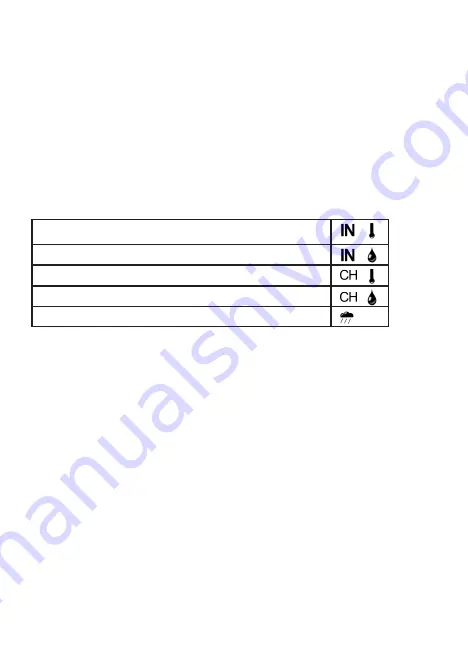
The following graphs are available, along with the relevant graph icons for each:
Indoor Temperature
Indoor Humidity
Remote Temperature (for the currently selected Channel ID)
Remote Humidity (for the currently selected Channel ID)
Rainfall
If viewing a remote temperature or humidity graph, this will always show information
from the currently selected channel. If you’d like to view remote temperature/humidity
information from a different channel, be sure to select the required channel first (using
the
CHANNEL
key) before navigating to one of the remote graphs.
The timeframe of each graph can also be changed between the last 24-hours and the last
72-hours using the Custom Display Mode – please refer to Page 20 for information on
how to do this.


