3ODQW:DWFK
Cod. Carel. +030221221 – rel. 1.0 dated 20/02/01
21
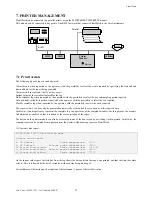
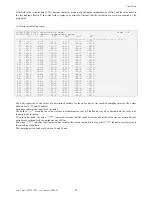
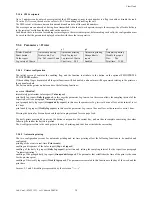
(5) - Grouped daily variables log report:
15/09/2000
13:53
Installation
name
Page:
1/4
10/09/2000 1: LT cabinet temperature probe
1:A 1:B 2:A 2:B 2:C 3:A 3:B 4:A
---|--------------------------------------------------------------------------
0| ----- ----- ----- ----- ----- ***** -19.9 6.9
1| -21.3 -21.1 -21.0 -20.7 1 -20.0 6.7
2| -20.0 -19.9 -19.9 -19.5 1 -19.9 -20.1 6.6
3| -20.0 -20.1 -20.5 -20.7 1 -21.0
-20.3 6.3
4| -21.3 -21.1 -21.0 -20.7 1 -20.0 -20.0 6.0
5| -20.0 -19.9 -19.9 -19.5 1 -19.9 -20.1 5.5
6| -20.0 -20.1 -20.5 -20.7 0 -21.0 -19.8 5.4
7| -21.3 -21.1 -21.0 -20.7 0 -20.0 -19.7 5.1
8| -20.0 -19.9 -19.9 -19.5 0 -19.9 -19.6 5.4
9| -20.0 -19.9 -19.9 -19.5 1 -19.9 -19.6 5.5
10| -20.0 -19.9 -19.9 -19.5 1 -19.9
-19.7 5.4
11| -20.0 -19.9 -19.9 -19.5 0 -19.9 -19.8 5.3
12| -20.0 -20.1 -20.5 -20.7 0 -21.0 -19.7 5.2
13| -21.3 -21.1 -21.0 -20.7 0 -20.0
-19.1 5.1
14| -20.0 -20.1 -20.5 -20.7 1 -21.0 -18.8 5.0
15| -21.3 -21.1 -21.0 -20.7 1 -20.0
-19.1 5.0
16| -20.0 -20.1 -20.5 -20.7 1 -21.0 -18.8 5.1
17| -21.3 -21.1 -21.0 -20.7 0 -20.0
-19.1 5.3
18| -20.0 -19.9 -19.9 -19.5 0 -19.9 -18.8 4.9
19| -20.0 -19.9 -19.9 -19.5 1 -19.9 -20.0 4.5
20| -20.0 -20.1 -20.5 -20.7 1 -21.0 -20.1 4.4
21| -21.3 -21.1 -21.0 -20.7 0 -20.0 -20.2 4.3
22| -20.0 -20.1 -20.5 -20.7 0 -21.0 -20.5 4.2
23| -21.3 -21.1 -21.0 -20.7 1 -20.0 -20.9 4.2
Key
1:A = LT Cabinet 1 - Probe temperature
1:B = LT Cabinet 1 - Defrost probe temperature
2:A = Frozen food island 1 - Probe temperature
2:B = Frozen food island 1 - Defrost probe temperature
2:C = Frozen food island 1 - compressor status
3:A = Frozen food cabinet 1 - Probe temperature
3:B = Frozen food cabinet 1 - Evaporator temperature
4:A = Frozen food cabinet 2 - Probe temperature
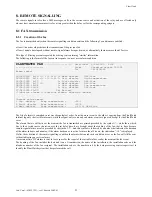
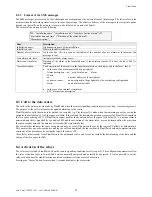
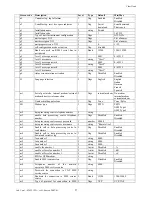
The grouped daily report shows the values of a series of variables on the same page for the entire day, at a set sampling interval
of 1 hour. The symbols are the same as described for report 4 above.
The values of the variables are grouped into columns, each column represents the temperature trend for the day at 1 hour
intervals. Each page of the report can print up to 8 variables.
Содержание PlantWatch
Страница 1: ... 3ODQW DWFK QVWDOODWLRQ DQG XVHU PDQXDO ...
Страница 2: ......
Страница 4: ......
Страница 6: ......
Страница 47: ......

