


1
EasyAG
®
Soil Water Content Profile Probes
1. General
EasyAG
®
probes measure a profile of volumetric soil water content. EasyAG
50 probe measures at 10, 20, 30, and 50 cm. EasyAG 80 probe measures at 10,
30, 50, and 80 cm. TriSCAN versions of these probes also measure soil
salinity.
Irrigation scheduling, waste water treatment, and other applications requiring
continuous monitoring of water or water and ion movement in a soil profile
may benefit from EasyAG technology. Water content measurements can be
made in all soil types. Salinity measurements are restricted to sand, loamy
sand, and sandy loam soils.
2. Absolute
Data
EasyAG probes calibrated for a particular site, including the textural layers of a
soil profile, will produce absolute and accurate data. Absolute data, however,
require that sensors be calibrated for each soil type and each soil horizon.
Absolute calibration is a costly and time consuming process, but must be done
if absolute data are required. A manual for absolute data calibration is
published by Sentek.
3. Relative
Data
Relative data are produced by an EasyAG calibrated for a range of soil types,
and this calibration is used as a default calibration on all soil types. Readings
cannot be considered as absolute data, but instead reflect soil water and ion
changes used as decision criteria in soil management.
Relative water content data have been used since at least 1992 for irrigation
management, isolating factors such as depth of irrigation and rainfall, depth of
effective root zone, onset of crop water stress, and avoidance of water logging.
Economic gains achieved with soil profile management in commercial
agriculture and waste water management are typically made using the concept
of
‘
relative
’
change in soil dynamics.
4. Measurements
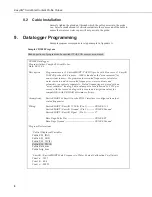
Sensors are measured by the
probe’s
SDI-12 interface. The interface transmits
measurements to the datalogger. TriSCAN sensors provide two outputs, water
content and salinity. Both outputs can be presented as dynamic trend changes
over a chosen time scale. Acceptable time stamp data range from 00:00:00 as
midnight to 23:59:59.
4.1 Water
Content
Sensor output is a dimensionless frequency (raw count) that is converted via a
normalization equation and then a default or user-defined calibration equation
Содержание EasyAG SDI-12
Страница 2: ......
Страница 3: ......
Страница 26: ...Appendix A Normalization and Function Test A 6 ...
Страница 40: ...Appendix B Tube Installation B 14 ...
Страница 42: ...Appendix C Site Selection C 2 ...
Страница 44: ...Appendix D SDI 12 Commands D 2 ...


