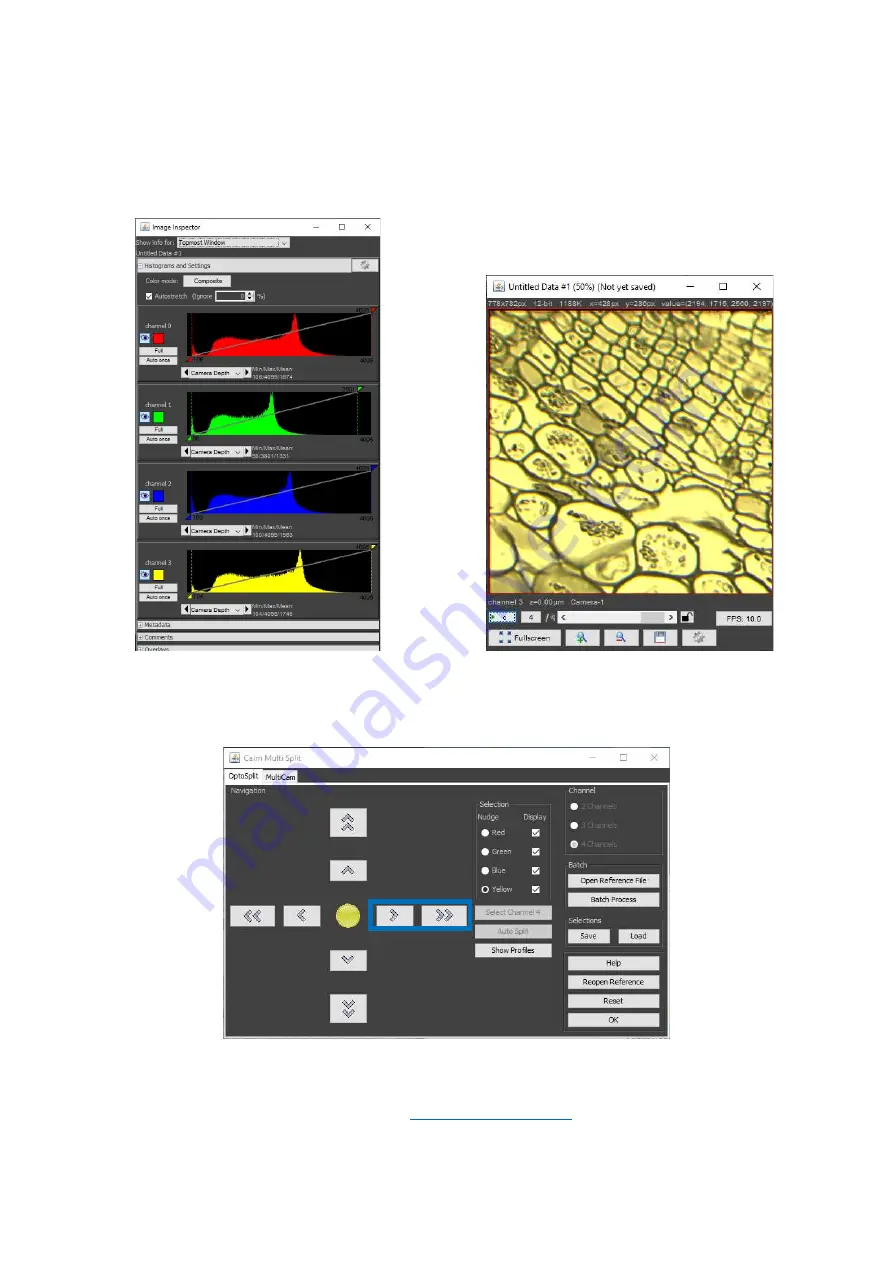
7.
Draw a rectangular region of interest (using ImageJ) around your longest (red) wavelength channel. Click on
‘Select Channel 1’.
8.
Move the same region of interest to the ‘green’ channel and click ‘Select Channel 2’.
9.
Similarly, repeat for the Blue (Channel 3) and Yellow (Channel 4). A four-colour composite overlay will now
be displayed, with individual intensity histograms for each channel.
10.
Each individual image can be nudged using the arrows within the Multi Split window, then saved once
complete.
If you have any questions during installation or use of the MultiSplit, please do not hesitate to contact our Tech
Support Team (
)


