


User’s Guide
116
3. In the
Inspector
, click the
Parameters
tab and select the
H
checkbox to select the height for each parameter.
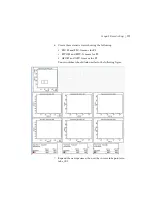
4. On the global worksheet, create the following plots and
histograms:
• FSC vs SSC dot plot
• FSC-H and FSC-A histogram
• FITC-H and FITC-A histogram
• APC-H and APC-A histogram
5. Create a P1 gate in the FSC vs SSC plot, and show only the P1
population in all histograms.
Содержание FACSymphony A3
Страница 4: ......
Страница 8: ...User s Guide 8...
Страница 14: ...This page intentionally left blank...
Страница 46: ...This page intentionally left blank...
Страница 86: ...This page intentionally left blank...
Страница 97: ...Chapter 6 Recording and analyzing data 97 e Click OK 12 Print the analysis...
Страница 98: ...User s Guide 98 Your global worksheet analysis objects should look like the following...
Страница 120: ...User s Guide 120 14 Adjust the red laser area scaling factor until the APC A signal matches the APC H signal if needed...


