


Page 9 of 17
On the oscilloscope you can see basic STAG controller signals:
lambda sensor, lambda simulation, TPS and actuator positions .
Below the graph, there is a signal table.
You can enable each graph and select its colour in the “Graph” column.
Apart from the oscilloscope, signal values are displayed in the “Values” column and visualised as line
graphs.
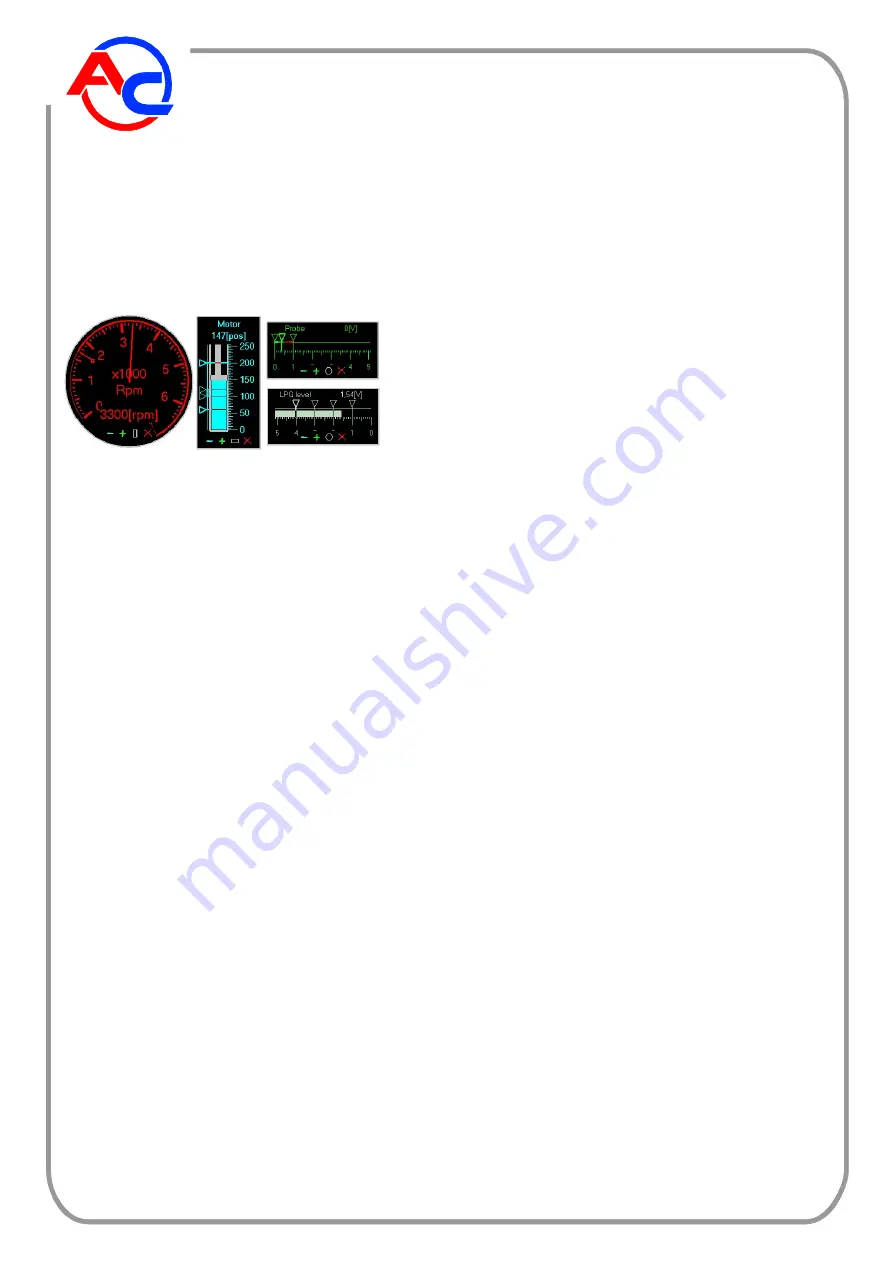
Gauge windows – display signals, it is possible to change
their position, size and shape ([-][+][O] buttons)
Additionally, in V1.77 version the windows of additional gauges are also accessible. They are displayed
by clicking a list below the “Gauges” button or by double-clicking relevant line in the signal table. It is
possible, separately for each such window, to change its position (using left mouse button), size ([-] [+]
buttons), shape ([O] button) and close ([X] button).
KEYBOARD SHORTCUTS
F1
- full function switch names / abbreviations
F2
- screen SETTINGS
F3
- screen PARAMETERS
F4
- screen CONFIGURATION
F6
- screen VERSION
F7
- parameter table activation for the screen PARAMETERS
F8
- working mode change GASOLINE / AUTO / LPG
NOTE: working mode change is possible also with mouse
F9
- font change
F10
- start of communication with the controller
QUICK CHANGE OF PARAMETERS
To change parameters and their values it is possible to use mouse buttons through
clicking on selected parameter as well as keyboard keys:
UP / DOWN
- parameter change
RIGHT / LEFT
- parameter value change
Содержание STAG-100
Страница 4: ...Page 4 of 17 STAG 50 installation diagram...


