GOLDENEAGLE AM 4.0.x user manual
– 07/2012
Page 57
Head Office
: Parc d’activites Kennedy - 20, avenue Neil Armstrong – F-33700 Bordeaux-Merignac (France)
Tel +33 (0)5 57 928 928
– Fax +33 (0)5 57 928 929 –
–
www.audemat.com
Table data can be exported using the “Export to CSV…” button and viewed in a spreadsheet application
such as Microsoft Excel.
10.2. Spectrum Analyzer
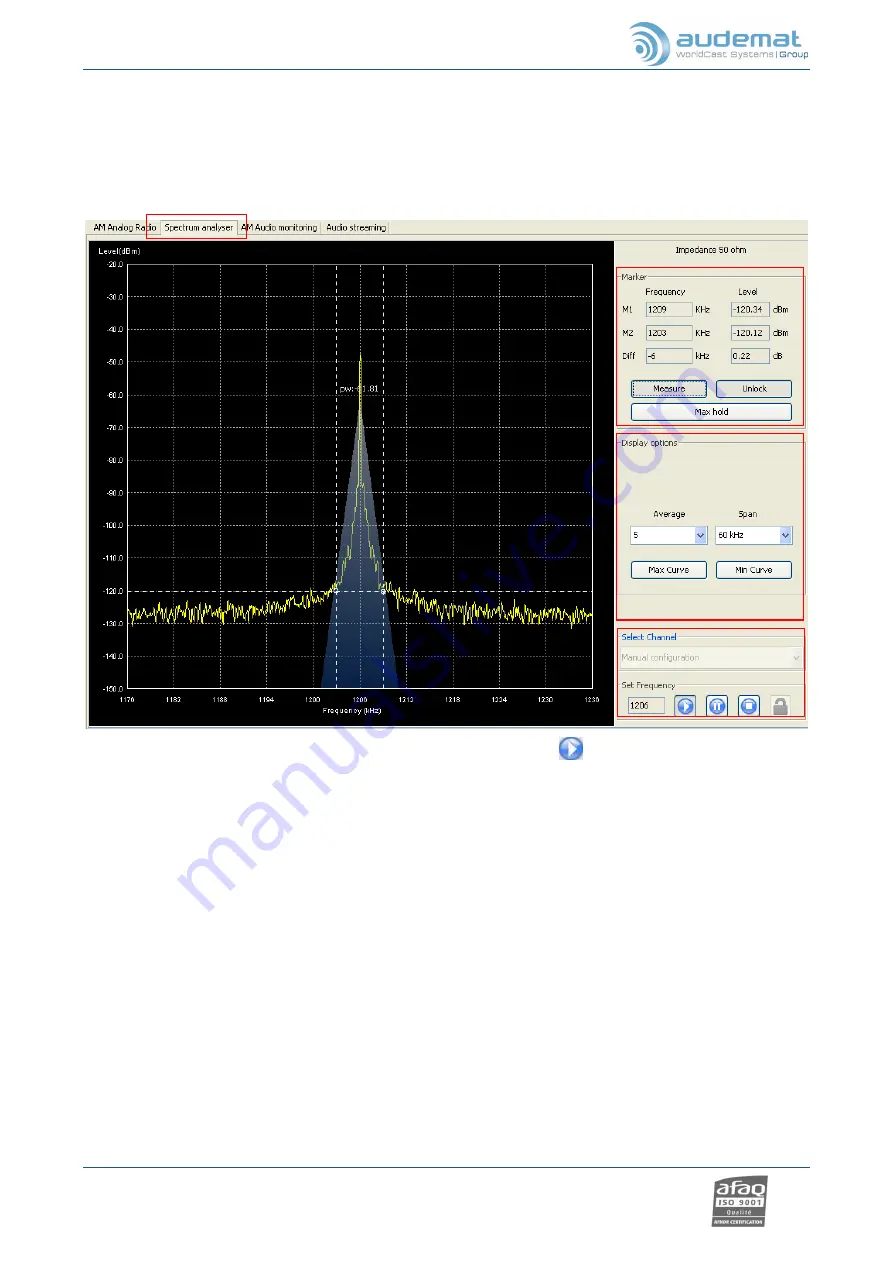
With the spectrum analyzer, get an accurate picture of the AM bandwidth around any given frequency.
Select the channel from the list or enter directly the frequency and click
(1)
.
The ‘Measure’ button in the ‘Marker’ box
(2)
activates the measurement marker feature, which allows you to
set two markers by clicking on the screen:
The software immediately calculates and displays the difference in frequency and level between these two
points on the graph.
By default each marker is locked on the amplitude value of the instantaneous measured values at their
respective frequencies. You can also do a ‘free’ measure by clicking the ‘Unlock’ button.
The ‘Max Hold’ button activates a specific measurement marker feature, which detect and lock automatically
on the maximum amplitude peak.
2
1
3


