


3
Functions and Measurements
32
N9342C/43C/44C User’s Guide
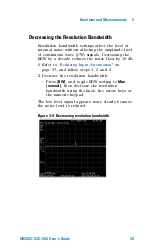
Measuring Multiple Signals
This section provides information on measuring
multiple signals.
Comparing Signals on the Same Screen
The N934xC can easily compare frequency and
amplitude signal differences, for example,
measuring radio or television signal spectra. The
Delta Marker function allows two signals to be
compared when both appear on the screen at the
same time.
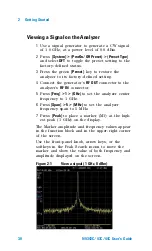
In the following example, a 50 MHz signal is used
to measure frequency and amplitude differences
between two signals on the same screen. The Delta
Marker function is demonstrated in this example.
1
Press
[Preset]
to set the analyzer to the factory
default setting.
2
Input a signal (0 dB, 50 MHz) to the
RF IN
connector of the analyzer.
3
Set the analyzer start frequency, stop frequency,
and reference level to view the 50 MHz signal
and its harmonics up to 100 MHz:
•
Press
[FREQ] > 40 > {MHz}
•
Press
[FREQ] > 110 > {MHz}
•
Press
[AMPTD] > 0 > {dBm}
4
Press
[PEAK]
to place a marker on the highest
peak on the display (50 MHz).
The
{Next Left PK}
and
{Next Right PK}
softkeys are
available to move the marker from peak to peak.
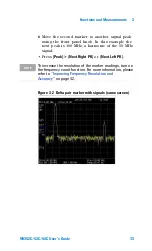
5
Press
[Marker] > {Delta}
to anchor the first marker
(labeled as M1) and activate a delta marker.
The label on the first marker now reads 1R,
indicating that it is the reference point.
Содержание N9342C
Страница 1: ... Agilent N9342C 43C 44C Handheld Spectrum Analyzer User s Guide ...
Страница 8: ......
Страница 39: ...31 AgilentN9342C 43C 44C Handheld Spectrum Analyzer 3 Functions and Measurements ...
Страница 92: ...3 Functions and Measurements 84 N9342C 43C 44C User s Guide ...
Страница 156: ...5 Error Messages 148 N9342C 43C 44C User s Guide ...
Страница 178: ...7 Menu Map 170 N9342C 43C 44C User s Guide ...