


20
3
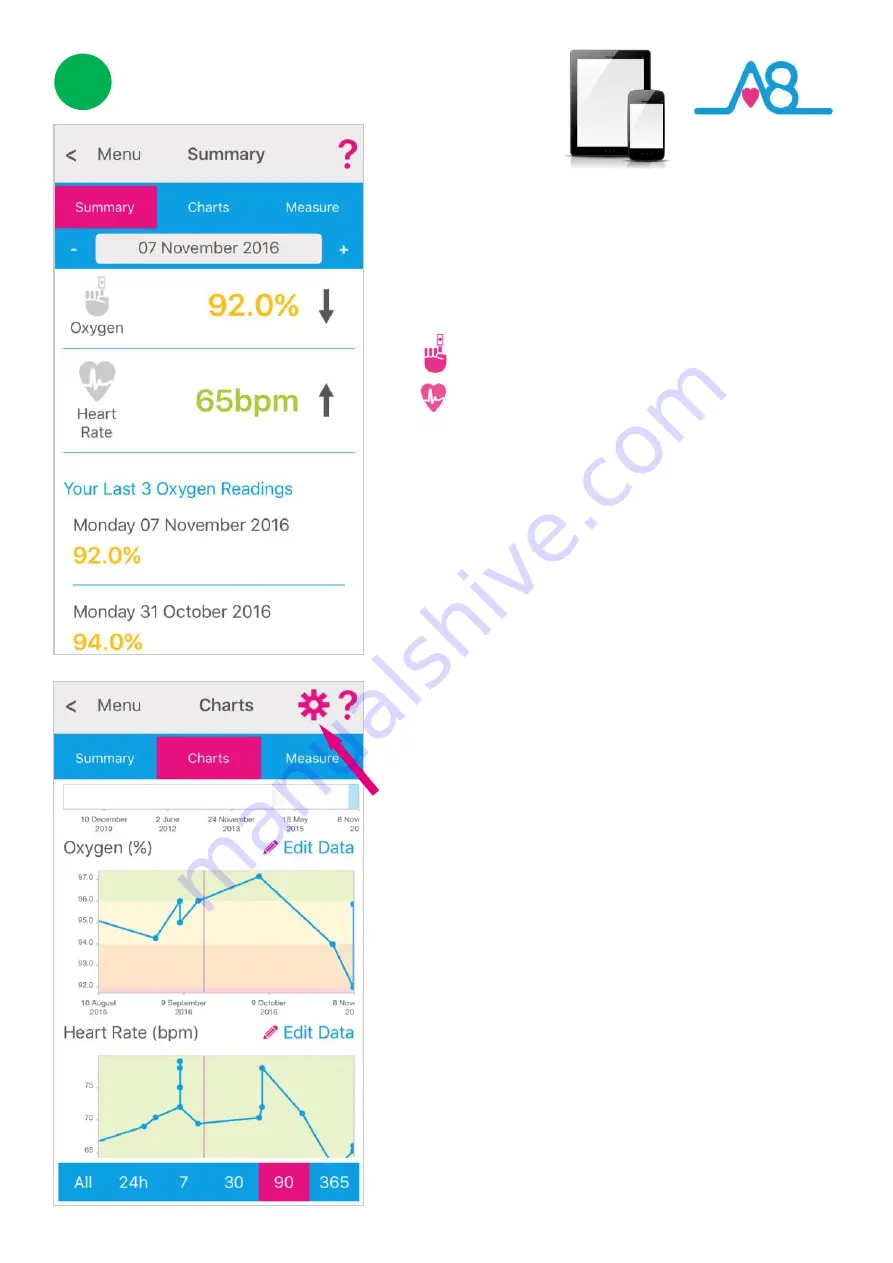
Viewing Data on Smartphone or Tablet
Detailed data can be viewed from the
Activ8rlives
4
Wellness App
. The example shown here gives:
Oxygen Saturation 92.0%
Poor NEWS = 2
Heart Rate 65bpm
Normal NEWS = 0
With an accumulated NEWS of 2. Refer to the Blood Oxygen
Chart on
Page 10
to see where your reading is placed in the
population table.
Colour coding of parameters within normal
Green
, alert
Amber
and out of parameter readings
Red
are easily seen on the
Summary
and
Charts.
The
arrows
beside your current reading indicate in which
direction your reading is going: i.e, rising, static or falling from
your last reading.
Your
last 3 readings
will be displayed below for your reference.
Detailed data
Charts
can be viewed from the
Activ8rlives
4
Wellness App
by selecting from the
Main Menu >
Health Data > Charts.
To change how these
Charts
display your data you can select
and deselect via the
Settings Cog
. Also change the
timeframe
from the bottom
blue selector
. Within this section you can start
to see trends of what affects your other health parameters, and
you begin to learn good behaviours or detect declining health.
The data displayed in this
Chart
shows the individual
’
s
Oxygen
Saturation
and
Pulse Rate
over a period of 90 days. You can
scroll through the
Chart
to the left and right to change the
timeframe.
Note:
If your
Activ8rlives
Pulse Oximeter2
is
NOT connected
to
your Smartphone or Tablet via Bluetooth, the data will
NOT be
stored on the
Activ8rlives
Pulse Oximeter2.


