32
Data Analysis Using the DataMap software
The DataMap software includes a 16-channel graph for displaying and analyzing the
data recorded by your Engine Analyzer. From the File menu, select File->Graph Log
File, or press the Analyze button after reading data from your Engine Analyzer to
enter the DataMap Analysis screen.
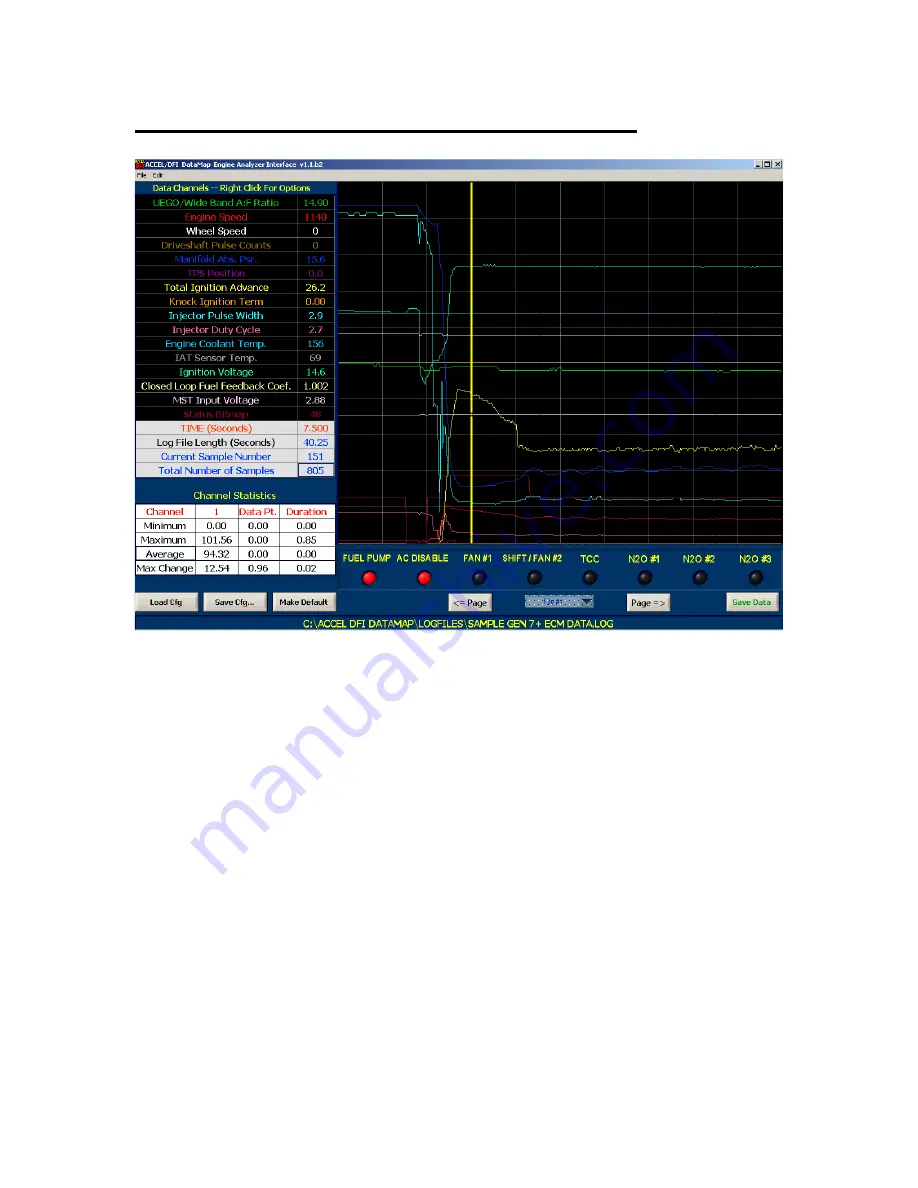
Once data is loaded from a file, it is displayed graphically on the screen, and
numerically along the left side of the display. The names of the data channels are
displayed along with their numerical values at the location of the vertical yellow
cursor on the graph. The current time at the location of the cursor, total length of
the log file, current sample number, and total number of samples are displayed
underneath the channel data display. Finally, calculations are made on each data
channel when the data is loaded from the log file. Clicking on a channel name will
display the channel minimum, maximum, average, and maximum change values for
each that channel.
Use the arrow keys on your keyboard or the mouse to change the location of the
yellow cursor on the data graph. Moving the cursor to a new data point will update
the numerical displays with the current data values at that point. Pressing SHIFT
and the cursor keys will move the cursor 10 data points to the right or left. Pressing
the CTRL and cursor arrow keys at the same time will shift the position of the active
trace within the confines of the data graph.


