Abus TAGTEMP Скачать руководство пользователя страница 6


ABUS TECHNOLOGIES INC.


TagTemp 

3.2 LogChart-II 


3.2.1 INSTALLING LOGCHART-II 


The  LogChart  II  is  the  software  provided  with  the  logger  to  allow  for  configuration  and  data 

collection.  To  install  the  LogChart  II,  execute  the 

LC_II_Setup.exe

  program  provided  in  the  CD.  The 

installation wizard will then guide you throughout the installation process.  

Note: Be sure your Windows date separator is configured as a slash: dd/mm/yy or dd/mm/yyyy. 

3.2.2 RUNNING LOGCHART-II 


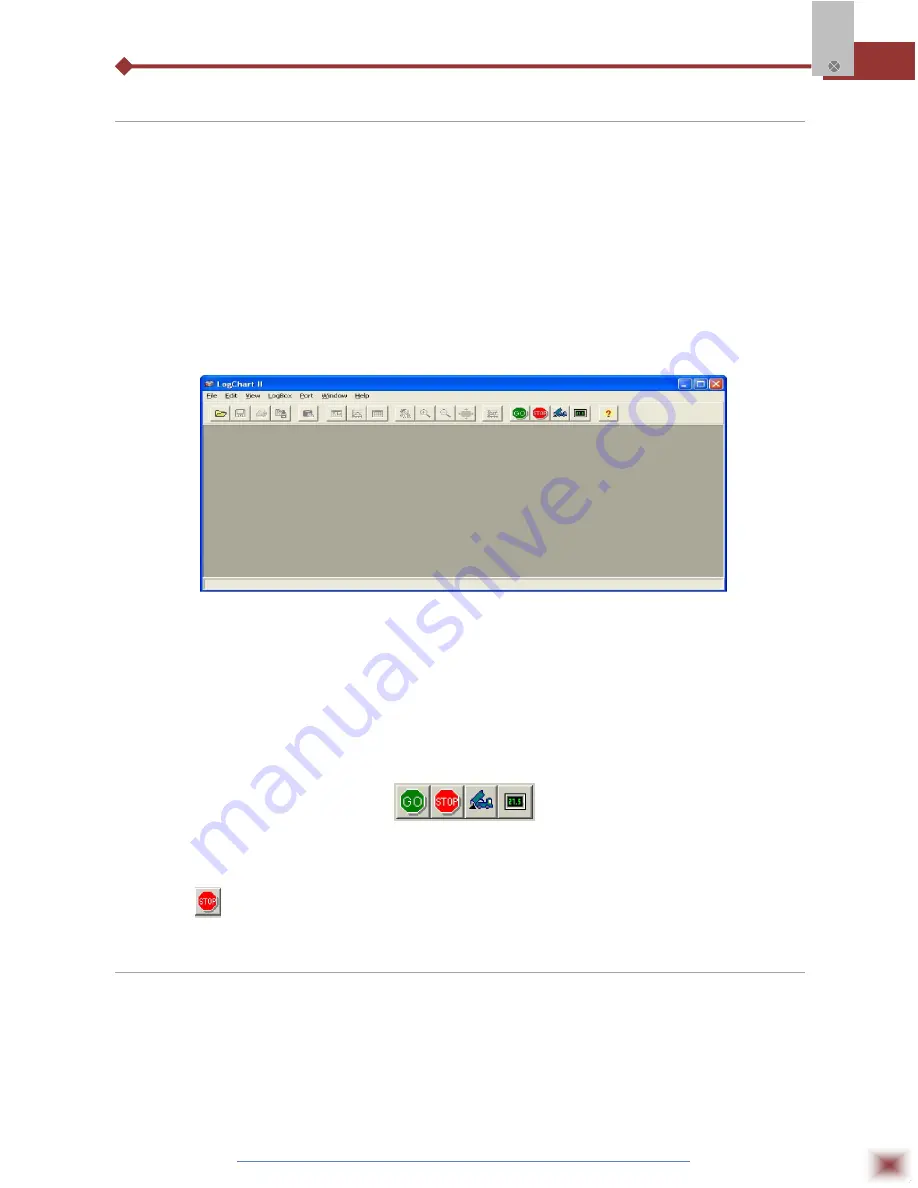
Start the program. The main window will appear on the screen, as shown in Figure below. 


LogChart-II main window 


The LogChart II requires a communication port to talk to the logger. Select one and connect the 

corresponding  wand  IR-LINK3  to  it.  Click  on  the  menu 

Port.

  Clicking  on  the  menu 

Port

,  all  free 

communication  ports  available  in  the  computer  will  be  listed  (usually  COM2,  once  the  mouse  is 

frequently  connected  at  COM1).  The  chosen  port  will  be  remembered  next  times  the  LogChart  II  is 

initiated.  When  the  selected  port  is  successfully  opened,  the  LogChart  II  initial  screen  is  opened, 

enabling the buttons below: 


Buttons enabled when the communication port of choice is valid


In case the user wants to stop the process while data logging is running, the button “Stop” must 

be pressed:


3.3 Optic Interface IR-Link3 


Configuring, monitoring  or  downloading  data from the logger  through  LogChart-II  requires  that 

the IR-LINK3 communication interface be connected to your PC. This interface is sold separately. The 

IR-LINK3 interface sends and receives data to/from the logger through infrared signals. 

Содержание TAGTEMP

Страница 1: ...TAGTEMP Data Logger User Manual ABUS TECHNOLOGIES INC...

Страница 2: ...sonal injury or death Therefore comply fully with all Warning and Caution notices Information in this manual is intended only to assist our customers in the efficient operation of our equipment Use of...

Страница 3: ...t II 3 Optic Interface IR Link3 4 Palmtop User 5 5 6 6 7 4 Configuration 1 General information Field 2 Acquisition Field 3 Start Loggings Field 4 Stop Loggings Field 5 Channels Field 6 Palmtop User 8...

Страница 4: ...ograms 2 PRESENTATION 2 1 Technical Parameters Measuring Range Temperature 20 C 70 C Accuracy 0 5 C 25 C 2 C max along the entire measured range Note A measurement error can be fixed using the OFFSET...

Страница 5: ...OG While in stand by not logging or after a series of measurements it flashes once at every four seconds During logging it flashes twice at every four seconds Alarm Indicator AL Warns the user as to a...

Страница 6: ...nding wand IR LINK3 to it Click on the menu Port Clicking on the menu Port all free communication ports available in the computer will be listed usually COM2 once the mouse is frequently connected at...

Страница 7: ...ality of the LogChart II is available for the PDA Palm running the LogChart PalmOS software The program is delivered with the logger The stalled in the Palmtop through a HotSync process data synchroni...

Страница 8: ...start the communication between the logger and the software the Parameters Configuration window is then displayed as shown in figure Configuration Window below showing the current configuration and in...

Страница 9: ...e and time Via Start Stop Button starts and interrupts readings by pressing the Start Stop button in the frontal part of the logger for two seconds See Figure 01 Setpoint acquisitions start when a tem...

Страница 10: ...n the PDA infrared wand to the logger communication window run the LogChart Palm OS software wake up the logger and press Search Device in the Recorded Data screen When the PDA finds the logger the Mo...

Страница 11: ...ption is selected a new box to define the stop logging time is displayed By Start Button Press the Start_Now button from the Monitoring screen to start logging The PDA must be turned towards the logge...

Страница 12: ...within an interval The minimum interval between measurements is 10 second Maximum The value logged will be the maximum value found within ten consecutive measurements taken within an interval The min...

Страница 13: ...g the LogChart II menu During data transference a status bar indicates remaining data to be transferred Data offloading time is proportional to the number of readings logged At the end of data transfe...

Страница 14: ...res and configurations and details about data acquired General Information window 5 1 3 Acquisitions Table Window Data acquired by one or both input channels user defined are displayed in engineering...

Страница 15: ...base and tap on Details Recorded Data Details screen shows information about the data base View Data shows in table format the logged values and the date and time they were performed Press Delete to...

Страница 16: ...ding to local legal rules or returned to ABUSTEK 7 After placing batteries back to the logger make sure the cover is firmly attached to the socket 6 2 Troubleshooting FAULT POSSIBLE CAUSE RESOLUTION L...

Страница 17: ...modify the instrument 9 All connections should be tightened properly 10 Power supply should be constant should not be fluctuating 8 WARRANTY ABUS provides the original purchaser of this instrument a...

Отзывы: