


AQUA M A STE R4
|
EL EC T R O M AG N E T I C FLO W M E T ER I N SER T I O N SEN S O R | O I/FE W4 0 0/A P - EN R E V. B
27
Velocity limitations
IMPORTANT NOTE
See also page 25 for maximum flow values for
insertion sensor
.
All insertion sensors are susceptible to the vortex shedding
effect that can cause severe vibration of the insertion sensor,
resulting in damage and/or measurement instability.
Electromagnetic devices with no moving parts, such as the
insertion sensor, are less susceptible to this effect than
mechanical devices.
Figure 27 shows the maximum permissible velocities,
depending on the insertion sensor's location. This information
is provided as a guide only. Some installations may experience
unwanted vibration resonance that may further limit the
maximum velocity at which the insertion sensor can be used.
Insertion
length
Effective
insertion
sensor
length
Figure 27 Maximum permissible velocity for different pipe sizes
It is important to add the external length from the fixing point
to the insertion length. Failure to do this can give incorrect
information from the graphs, resulting in vortex shedding
affecting the insertion sensor.
Examples:
• A 600 mm (24 in) pipe with the insertion sensor mounted
on the center line has an insertion length of 300 mm (12 in).
• A typical valve is approximately 250 mm (10 in) high and the
distance to the support point inside the insertion sensor is
approximately 100 mm (4 in) therefore, in this example, the
total effective length is 650 mm (26 in).
• Max velocity at 650 mm is 3.6 m/s.
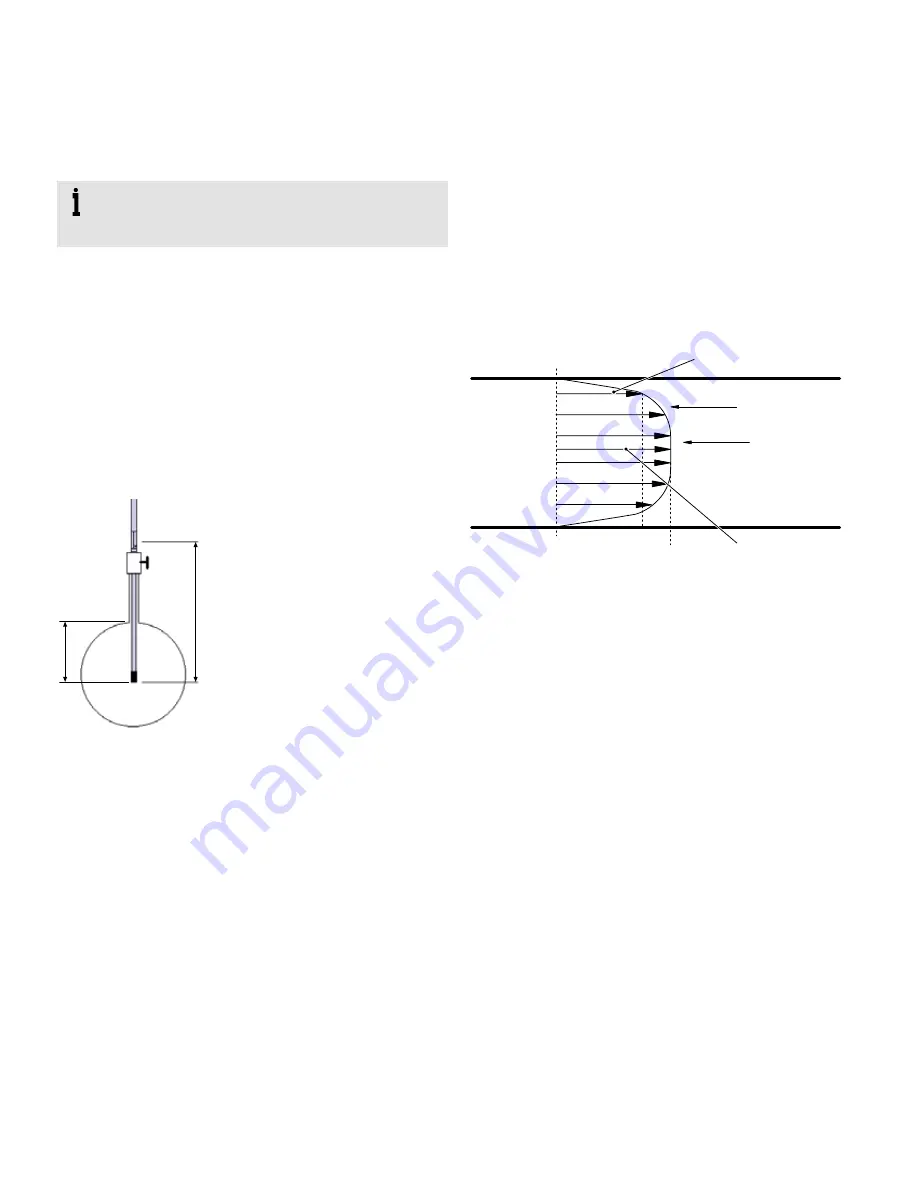
Velocity profiles background
Figure 28 shows a fully-developed turbulent profile of the flow
within a pipe. Such diagrams illustrate the distribution of flow
within the pipe. Known as the Flow Profile, it is highest in the
center falling to zero at either side on the pipe wall. If there is
sufficient upstream straight pipe, it can be assumed that there
is a profile of this form. In this case if, for example, the pipe is
600 mm in diameter, the velocity at the center line is 2 m/s and
the flow is 487 l/s
Mean velocity factor
Max. velocity
factor
Rapidly changing
velocities
Flat part
of curve
1.722 m/s
2.00 m/s
Figure 28 Turbulent flow profile
As the volume flow is known, the mean velocity in the pipe can
be calculated – note that it is actually 1.722 m/sec lower than
the velocity measured on the center line. Careful Investigation
of this profile or vector diagram reveals that the mean velocity
of 1.722 m/sec occurs at a point 72.5 mm or 1/8
th
of the pipe's
diameter in from the edge of the pipe. This point is referred to
as the Point of Mean Velocity (for a fully developed turbulent
flow profile only). This is true (provided the profile is turbulent
and fully developed) for all pipes of all sizes and at all flow rates,
and is recognized in the British Standard referred to previously.
Therefore, the best position to measure velocity is at the Point
of Mean Velocity, i.e. 1/8
th
of the diameter in from the edge of
the pipe. By placing the insertion sensor at this point a
straightforward calculation of volume flow can be performed –
but there is more to be considered.


