Appendix D: PC Communications
Viewing your Heat Stress data in QSP-II
053-664, Rev.C
QUESTempº 44 & 46 models
32
Filing
system
Explanation
Organizer Node
Used to organize your data. When the data is first
retrieved/downloaded, it is stored under the “Downloaded
Node”. You can organize your studies into topics as you may
do with your email system or your computer files.
Right-click to display the menu options (rename, find,
delete, add a node, combine a node, export). To rename,
right-click rename and type in a new name.
Meter Config
In a table format, this displays the set-up parameters (i.e.
thresholds, peak, logging, auto-
run, etc..) or “meter
configuration”
of the particular study.
Session
A session folder stores one study or a series of studies. A
number of studies in a session file depend on the number of
studies (Run/Stops) that are stored in the instrument when
data is retrieved. (The data will stay on the instrument until
you clear it.)
Study
A study is comprised of data from one sampling (performed
when you press Run then Stop on the QT
º
44/46).
Once selected, you can customize the panels (charts/graphs)
and reporting features.
Right-click to display the menu options (export, print
report)
Session Report If you created a report, this will store as an Acrobat Adobe .pdf
file under the study file.
Table 1-2:
Downloading data in QSP-II explained
4.
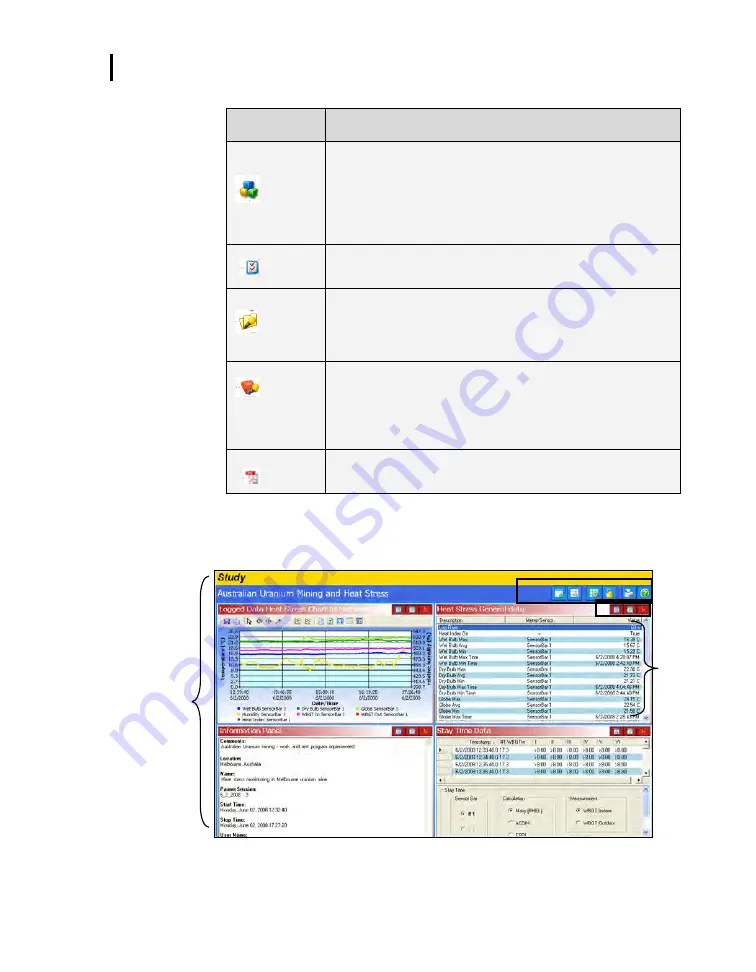
The right-side pane displays graphs and charts which are
customizable via the layout icon toolbar. (For further information,
please refer to QSP-
II’s Help Contents.)
Figure 1-29:
Viewing layout view (charts and graphs) in QSP-II
B
A
D
C


