


User Manual
QuantorMed Plus
TM -721-EN
52
8.8.
QA
– LUT Curve
Used to adjust the LUT Curve of the image. Adjusting the image requires expert knowledge
about images. Adjusting the image without proper knowledge may result in lower image quality.
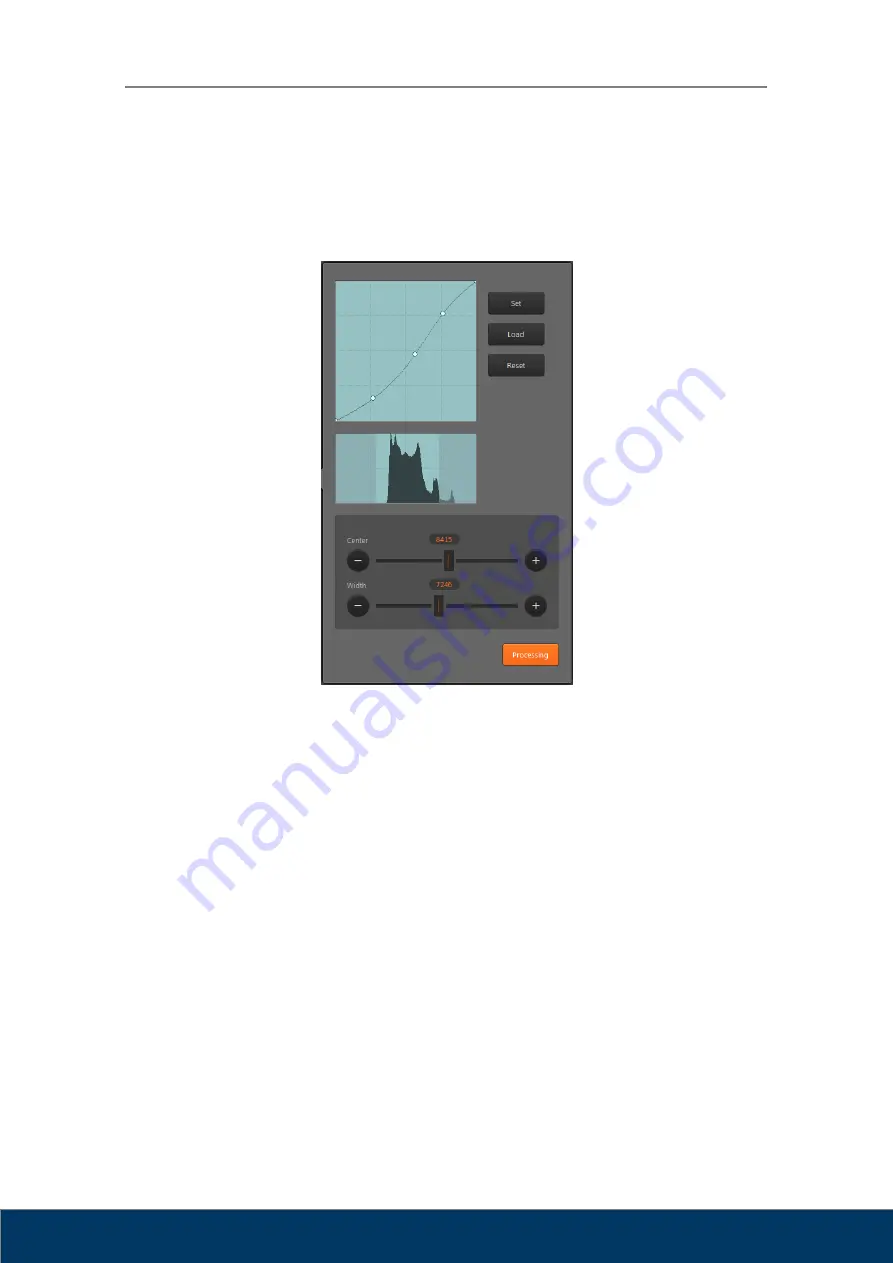
Figure 8.6. LUT Curve
①
LUT Curve: LUT curve applied to the image. A default curve for each region is provided.
The user can adjust the curve to their preference. To adjust the curve, set a control point
and drag the curve using the mouse. To add a new control point, click on the line using the
mouse. A control point can be removed by dragging it outside the box.
②
Histogram: Shows the histogram of the image. The bright region at the center is the region
currently displayed on the screen. The left part of the histogram indicates the frequency
where X-ray penetration level is low and image is bright. The right part of the histogram
indicates the frequency where X-ray penetration level is high and image is dark. Images
have low pixel values in bright regions and high pixel values in dark regions.
③
Window Center / Width: Used to adjust the window center and width of the image. The
window center is adjusted when you drag the image up or down, and window width is
adjusted when you drag the image left or right. Dragging the sliders have the same effect
as dragging the image.
①
②
⑥
⑦
③
④
⑤


