28
YRL3V2 Series User Guide
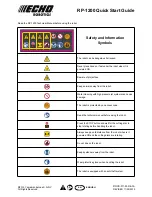
5.8 Visualization Settings
You can set the point cloud data to be displayed on the LiDAR viewer.
Select the following tab to open a new window where you can make detailed settings:
1
Item
Description
1
LiDAR Data
Visualization
•
Point cloud Color Mode: Set the color mode for the point cloud.
Note:
This feature helps users easily recognize the surrounding situation
using changes in color and vertical data. Select and use the color settings
that suit your needs.
-
Z-axis Coloring: Default option. Displays the reference axis (Z-axis)
and color change. Colors include red, orange, yellow, green, blue,
indigo, and violet. The smaller the Z value, the closer to red. The
larger the Z value, the closer to violet.
-
Intensity Coloring: The color displayed depends on the intensity of
the reflected laser. Colors include red, orange, yellow, green, blue,
indigo, and violet. The greater the intensity, the closer to red. The
smaller the intensity, the closer to violet.
•
Point cloud Size: Adjust the size of the point cloud.
-
Default: 1, Min: 1.00, Max: 10.00
•
Point cloud Stack (sec): Accumulate the point cloud data for the set time
and visualize it in real time. The greater the stack value, the higher the
resolution of the displayed data.
-
Default: 10, Min: 0.05, Max: 100