<1. INTRODUCTION AND GENERAL DESCRIPTION>
1-6
IM 12A01A02-01E
8th Edition : Oct. 01, 2015-00
n
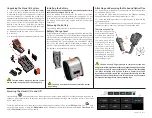
Monitor display
10.38
pH
C
A
B
Figure 1.5
Example of monitor display
Monitor display
The Monitor display appears upon startup when the MONITOR display is enabled.
When the measurement value (primary value) on the main or home display is pressed, the
monitor display appears.
A: Measurement value
B: Unit
C: Sensor No.
n
Main display
10.38
Tag:PH
TEXT_PH1
TEXT_ORP1
TEXT_TEMP1
19
25.0
mV
4mA
20mA
PH1
°C
pH
HOLD
WASH
Go to Home
(Figure 1.8)
Go to Zoom
(Figure 1.10)
Go to Information
(Figure 1.12)
Go to Execute & Setup
(Figure 1.13)
B
C
A
D
J
G
E
F
K
H
M
L
Figure 1.6
Example of main display
Main display
The Main display appears upon startup when one sensor is connected and the MONITOR
display is disabled.
A: Measurement value: Primary value (large characters/user selectable)
B, C: Measurement value: Second and tertiary values (small characters)
D: Unit for the primary value
E: Tag No. (user programmable)
F: Sensor No. *
G: Sensor wellness indicator (More ■ indicate the better condition.)
H: Hold/Wash indicators (appear only during the Hold/Wash operations)
J: Analog output display and parameter
* (ex.: PH1…PH=Parameter, 1=sensor number)
K: Additional text (set in alphanumeric characters/user programmable)
L: Function buttons (Home, Zoom, Status, Execute & Setup)
M: Fault/Warning indicators (indicated in blinking only during Fault/Warning status)
* When the parameter of which measurement value is indicated is selected as a process
parameter, that is, mA output set on the Output setup (refer to the section 5.3, 8.2, 11.2, and
14.3), its Sensor No. is indicated as a white number in the black box, for example
, and its
mA output is indicated as a bar at the bottom. At the bar, a parameter symbol is indicated.