™
Page 35 of 67
3 Using the vLoc3 RTK-Pro
65.3
25dB
640Hz
4G
6. If the bar graph is not steady it will most likely be because the sonde is not within range. In this case hold the locator at
approximately 45 degrees to the ground and rotate the locator around a full 360 degrees around you.
7. Note the direction of the strongest signal and walk towards it until the bar graph shows a steady signal. Now revert to step
five above.
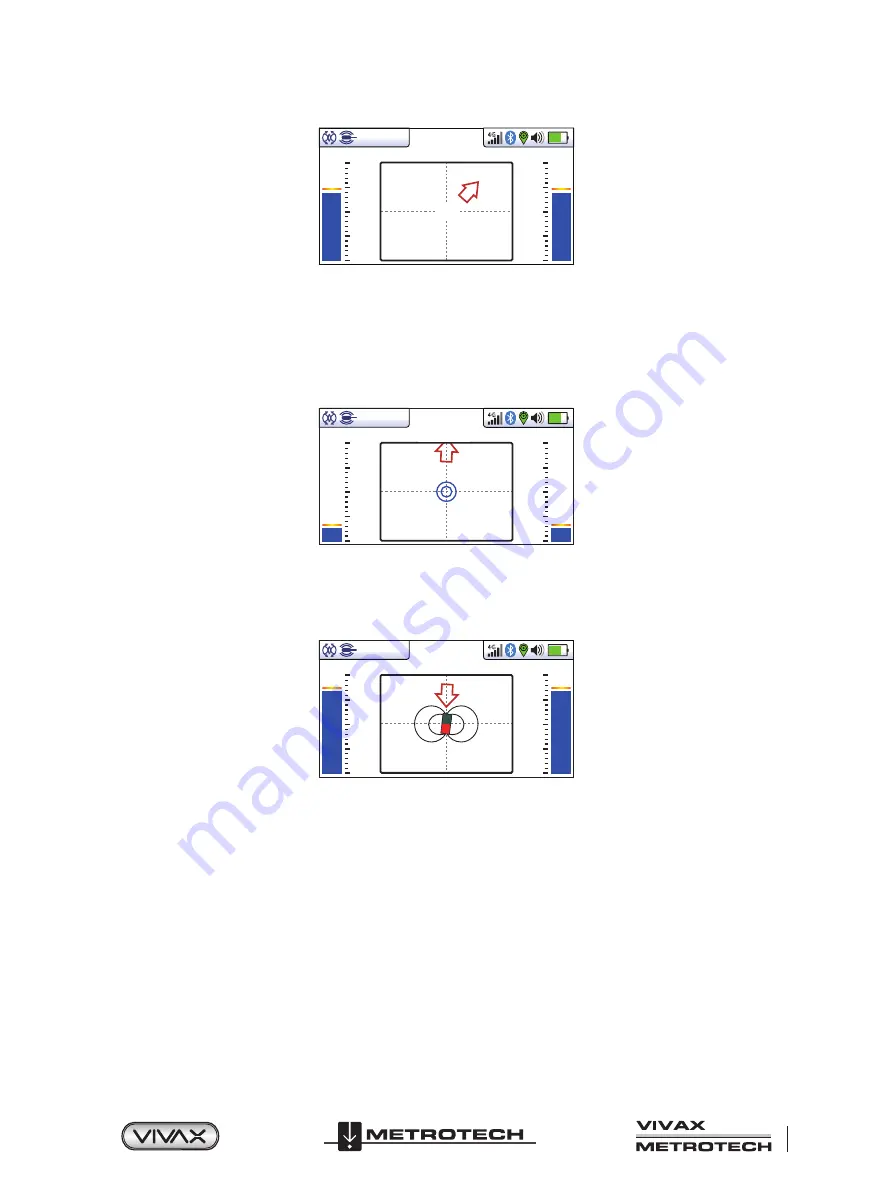
8. Walk slowly in the direction of the arrow.
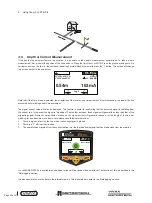
9. A double circle will appear on the screen. This indicates the position of a null signal. Walk toward it and position it over the
crosshairs of the screen. Now rotate the locator so that the arrow is pointing forward.
88.1
32dB
32.8kHz
-----
4G
10. Keeping the null indicator on the vertical line, walk toward the arrow.
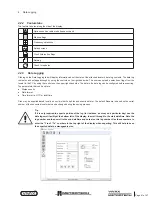
11. A Sonde icon will soon appear. Keeping the locator vertical, carry on walking toward the Sonde until it is positioned on the
crosshairs. The locator is now directly over the Sonde. The arrow will flip forward and back as the position is crossed.
82.9
22dB
32.8kHz
-----
4G
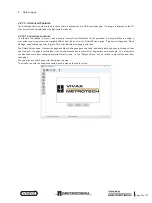
12. Note that when directly over the Sonde, it may be necessary to confirm the position of the Sonde, left to right. To do this
move the locator left to right to identify the position of the strongest signal as indicated on the bar graph. At this time the
depth to the Sonde will be displayed at the top of the display.
13. Having pinpointed the position of the Sonde, it can now be pushed to a new location and the process repeated. It is
advisable to keep the survey intervals too short distances such as six feet (two meters) as this makes the process of
locating easier.
14. Pressing the Information key allows access measurement data and data logging capabilities.


