VS Series Leak Detector Wireless Remote
1-4
DRAFT 11
/2/06
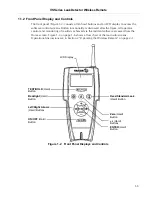
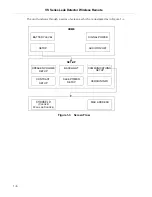
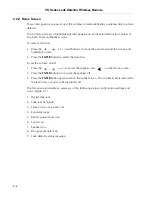
LCD Display
Represents:
❑
Leak Rate - in a Bar Graph format with a numeric range
indicator
❑
Leak Rate, System Status and Parameters - in alphanumeric
format
❑
Series of
screens
with the hard key buttons for operator
interface
Leak Rate, System Status and Parameters in alphanumeric format:
❑
Leak Rate is presented in a scientific notation: XXE-YY with
appropriate units
Where: X .X mantissa is a leak rate value
E- Y = 10-YY exponent is a leak rate range
X and Y are any numbers from 0 to 9
❑
System Status and/or Mode are represented on the screen in
alpha format on the screen and an italic font in this manual
❑
Parameters are represented on the screen in alphanumeric
format a bold font in this manual.
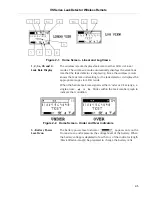
Leak Rate Bar Graph
The large bar graph displays the leak rate in one of two forms:
❑
A linear bar graph - Mantissa (2 divisions per segment, 10
segments per decade)
❑
A logarithmic bar graph - Mantissa (2 divisions per segment).
The displayable ranges for each of the UNITS that the
system can operate in are:
❑
For LOG, display bar graph atm-cc/sec across E-11 to E-3
❑
For LOG, display bar graph mbar-l/sec across E-11 to E-3
❑
For LOG, display bar graph Torr-l/sec across E-11 to E-3
❑
For LOG, display bar graph Pa-m3/sec across E-12 to E-4
❑
For LOG, display bar graph Cubic Ft/year across E-8 to
E-0
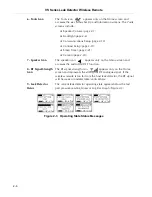
Over-range and under-range conditions are indicated using:
❑
> - To the right side of the bar graph indicates an over-range
condition.
❑
< - To the left side of the bar graph indicates an under-range
condition.

