background image

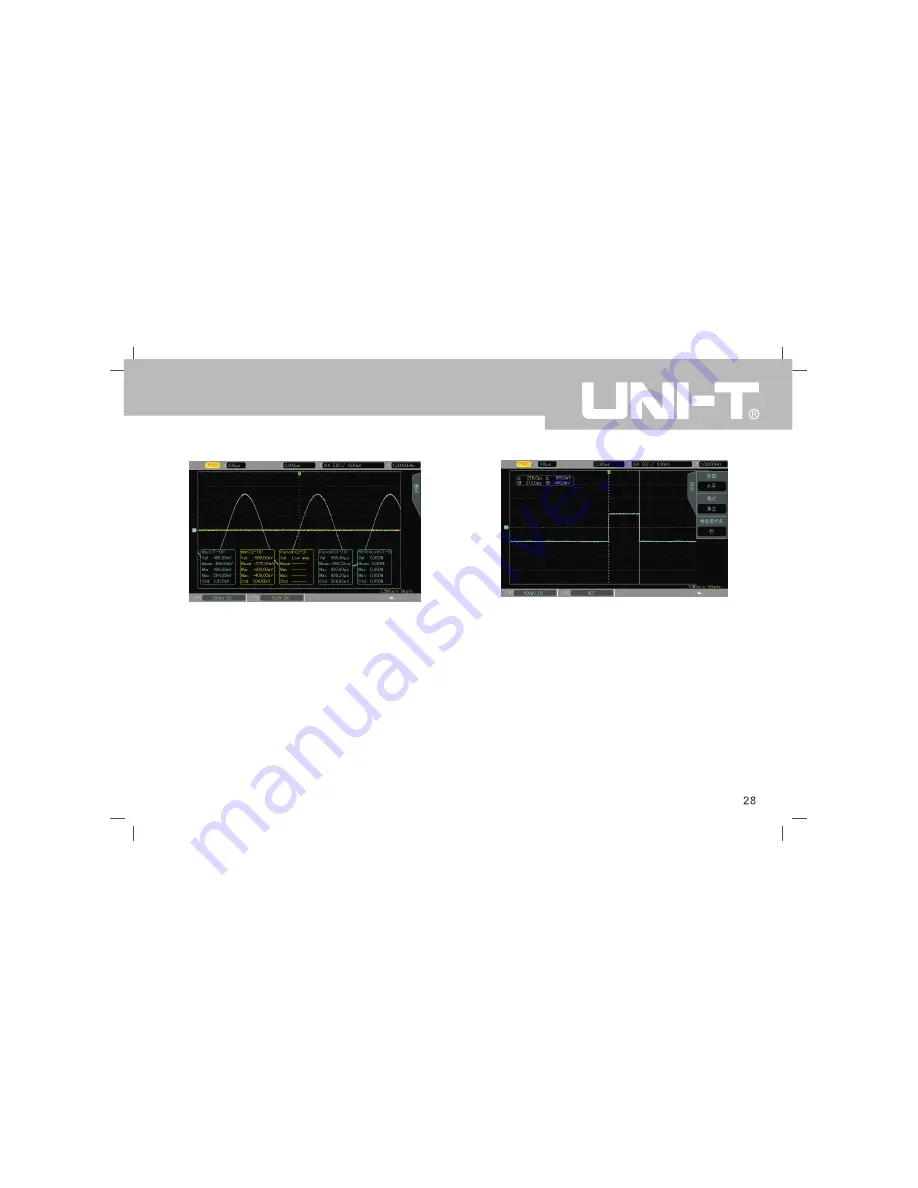
Open the D-value measurement statistics after defining parameter 

Chapter 9 - Cursor Measurement

The cursor can be used to measure the X axis (time) and the Y axis 
(voltage) of the selected waveform. Press the CURSOR button to enter 
the cursor measurement menu.

9.1 Time Measurement

Press the CURSOR key to enter the cursor measurement menu, then press 
F1 to select the type to time.
• Press F2 to set the pattern to independent.
• The Multipurpose knob can adjust the vertical cursor AX, press the 

  multipurpose knob to switch to cursor BX.

The measured values are shown in the upper left corner of the waveform 
display area. The value of BX-AX is the time measurement, and 1/|BX-AX| 
is the reciprocal of time.
For a periodic signal, if AX and BX are set at the rising edge of adjacent 
cycles, then BX-AX is the signal’s period, and 1/|BX-AX| is the frequency.
The voltage value can also be displayed at cursor’s current position. That 
is AY, BY, and BY-AY.The Multipurpose knob can be used to adjust the BX 
and AX positions when setting is set to trace mode with using the F2 key.

9.2 Voltage Measurement

• The method for voltage measurement is similar to the method for time 
  measurement, only that the vertical cursor becomes the horizontal cursor.
• Press the CURSOR key to enter the cursor measurement menu, then 
  press F1 to select the type as voltage.
• Press F2 to set the pattern to independent
The Multipurpose knob can be used to adjust the horizontal cursor AY on 
the screen, press the Multipurpose knob to switch to cursor BY. The value 
of BY-AY is the voltage measurement (V). When the setting is set to trace 
mode with using the F2 key, the Multipurpose knob can adjust both AY and 
BY at the same time.

UTD2000CEX-II 

User Manual


Summary of Contents for UTD2000CEX-II Series

Page 1: ...UTD2000CEX II Series Digital oscilloscope User Manual ...

Page 2: ...lse trigger 12 3 4 Video trigger 13 3 5 Slope trigger 14 3 6 Under amplitude trigger 15 3 7 Over amplitude trigger 16 Chapter 4 Horizontal system setting 17 4 1 ROLL scroll mode 17 4 2 Windows extensions 17 4 3 Independent Time Base 18 Chapter 5 Mathematical operation 18 5 1 Mathematical function 18 5 2 FFT 19 5 3 Logical operation 20 Chapter 6 Sampling system setting 21 6 1 Sampling rate 21 6 2 A...

Page 3: ...key 36 12 1 Auto setup 36 12 3 Factory setting 36 Chapter 13 System prompt and troubleshooting 13 1 System prompt information explaination 37 13 2 Troubleshooting 38 Chapter 14 Technical specification Chapter 15 Appendix 42 Appendix A Accessories and options 42 Appendix B Maintenance 42 Appendix C Warranty overview 43 Appendix D Contact us 43 29 30 11 4 waveform record 33 11 5 AUTO strategy 34 11 ...

Page 4: ...cessories and fuses are not included in this warranty If the product is proved defective within the warranty period UNI T reserves the rights to either repair the defective product without charging of parts and labor or exchange the defected product to a working equivalent product Replacement parts and products may be brand new or perform at the same specifications as brand new products All replac...

Page 5: ...se this product in accordance with the regulations Only trained personnel can perform the maintenance program Use the correct power line Only use the dedicated UNI T power supply appointed to the local region or country for this product Correct Plug Don t plug when the probe or test wire is connected to the voltage source Ground the product This product is grounded through the power supply ground ...

Page 6: ...llowing symbols may appear on the product Perface This manual describes the operation of the UTD2000CEX II series digital oscilloscope The manual includes the following sections Chapter 1 Introduction Guide Chapter 2 Vertical channel setting Chapter 3 Trigger system setting Chapter 4 Horizontal system setting Chapter 5 Mathematical operation Chapter 6 Sampling system setting Chapter 7 Display syst...

Page 7: ...ction Support Plug and Play USB devices and can use USB interface to communicate with the computer Chapter 1 Introduction Guide This chapter introduces on using the oscilloscope for the first time the front and rear panels the user interface as well as the built in help system 1 1General Inspection It is recommended to follow the steps below before using the UTD2000CEX II series for the first time...

Page 8: ...he probe and the input channel Please follow the following steps Set the attenuation coefficient in the probe menu and the switch on the probe to 10x and connect the probe to CH1 Make sure the probe s c onnector is properly connected with the oscilloscope Connect the probe s main clip and ground clip to the oscilloscope s calibration and ground terminal respectively Open CH1 and press the button O...

Page 9: ...front panel to Power On AC power input socket AC power input port Use the power cord supplied within the accessory package to connect the oscilloscope to the AC power supply the power supply for the oscilloscope to require is 100 to 240 V 50Hz 60Hz 1 5 Operation Panels This section describes the front panel operations to help users to quickly familiarize with the UTD2000CEX II series 1 Vertical Co...

Page 10: ...the vertical scale of the current waveform The vertical scale has 1 2 and 5 steps 3 Trigger Control Trigger Level Knob used to adjust the currently selected trigger level Press to pop up the trigger menu Press to force generate a single trigger event Press to display the built in help information Press to center the trigger level trigger position and channel position simultaneously UTD2000CEX II U...

Page 11: ...ure setting key can set measure source to all parameters custom parameters and perform measurement statistics select measurement indicators etc Sampling setting key set up acquisition mode and the storage depth Storage interface key can select different types for storage and waveform which can be stored internally or through USB device Cursor measurement key can measure waveform s time and voltage...

Page 12: ...H2 contains 3 states open activate and shut down Open Allows the corresponding channel waveform to be displayed on the screen Activate Only opened state can be activated In the active state the vertical menu and the vertical control knobs POSITION SCALE are available for changing activated channel setting Any of the channels that has been opened but not been activated could be activated by perssin...

Page 13: ...d displays data When the trigger signal is generated it automatically switch to trigger scanning and signal synchronization 2 2 Channel Coupling Using CH1 as an example when a signal is connected to CH1 and activated press F1 and select channel coupling via the multipurpose knob You can also switch to channel coupling by continuously pressing the F1 key Press the multipurpose knob to confirm selec...

Page 14: ... trigger For example normally the input channel CH1 CH2 trigger sensitivity is 1div which means the signal should be at least 1 div 5 Pre Trigger Delayed Trigger Data collected before after the Trigger event Trigger position is usually set at the level center of the screen and you can observe 7 grids of pre trigger and delay trigger information The horizontal displacement of the wave can be adjust...

Page 15: ...ess F1 to select trigger type and select the Pulse Width Trigger mode with using the Multipurpose knob The pulse width trigger setting menu 1 Options Pulse Width CH1 CH2 EXT AC Line DC AC High frequency suppression Low frequency suppression Noise suppression Auto Normal Single Functions Type Sources Trigger Coupling Trigger Mode Pulse Width Setting Next Page Descriptions Set any one of the CH1 CH2...

Page 16: ...veform of the video signal includes the image signal and the time sequence signal and each kind of signal uses different standards and formats UPO2000CEX II provides the basic measurement functions which can be triggered in NTSC PAL and other standard video formats Press the TRIG MENU Press F1 to select the trigger type set to video trigger mode with using the Multipurpose knob The video trigger m...

Page 17: ... 1 23MHz Suppression of signal frequency below 680kHz Suppress the noise of the trigger signal trigger sensitivity is halved When the signal input is not triggered the system automatically collects the waveform data and displays the scan baseline on the screen When a trigger signal is generated it automatically turns to the trigger scan The data acquisition stops when the signal is not triggered G...

Page 18: ...er one Press the TRIG MENU button to enter the trigger menu Press F1 to select trigger type and use the Multipurpose knob to select Under range Trigger mode Under range Trigger Menu 1 Descriptions Set any one of the Ch1 CH2as a trigger signal Pass all components of the signal Blocks the DC components of the signal Suppression of signal frequency above 1 23MHz Suppression of signal frequency below ...

Page 19: ...scriptions Triggers when set pulse width is less than under range width Triggers when set pulse width is greater than under range pulse width Triggers when set pulse width is equal to under range pulse width Use the multipurpose knob to set the pulse width time in 20 0ns 10 0s range Options Positive Polarity Negative Polarity Irrelevant 20 0ns 10ns Functions Polarity Condition Time Setting The slo...

Page 20: ...L knob The slope of the high threshold level can be adjusted with the LEVEL knob The slope of the high and low threshold level can be adjusted with the LEVEL knob Chapter 4 Horizontal System setting 4 1 ROLL mode When the trigger is in automatic mode and using the SCALE knob to adjust the horizontal level to slower than 50ms div and the oscilloscope will be in ROLL mode At this point the trigger s...

Page 21: ... release and suppression the oscilloscope will not be triggered For example a set of pulse series which is required to trigger on the first pulse can set the release time to the pulse width Press the HORI MENU button to enter the level control menu Use the Multipurpose knob to select trigger release Chapter 5 Mathematical Operation UTD2000CEX II series oscilloscope carries a variety of mathematica...

Page 22: ... FFT menu Descriptions Set any one of the CH1 CH2 for FFT source Use Hamming Window Function Use Blackman Window Function Use Rectangle Window Function Use Hanning Window Function Set vertical unit as linear or dB log Options FFT CH1 CH2 Hamming Blackman Rectangle Hanning Vrms dBVrms Functions Type Source Window Vertical Unit FFT Tips Signals with DC components might cause mistakes or inaccuracies...

Page 23: ...to measure the single frequency signal to find higher harmonics 2 Set Vertical Unit Vertical units can be Vrms or dBVrms Press F4 to select the desired unit Vrms and dBVrms show the vertical amplitude by means of logarithmic and linear To display the FFT spectrum in a larger dynamic range dBVrms can be used 5 3 Digital Filter Press MATH button then press F1 to select digital filter to enter the me...

Page 24: ...torage depth 2 512 Auto OFF ON Descriptions Sampling in a normal manner Sampling with peak detection Sampling with a high resolution Sampling in an average manner Options Normal Peak High Resolution Average Functions Sampling Mode Average Storage Depth Fast sampling 6 1 Sampling Rate 1 Sampling and Sampling Rate When the analog signal is sampled the sample is then converted into digital data The d...

Page 25: ...s the ACQUIRE key then press F1 key to switch the acquisition methods 1 Normal Sampling In this acquisition mode the signal is sampled and reconstructed with equal time intervals For most waveforms the use of this mode can produce the best effect 2 Peak Sampling In this acquisition mode the maximum and minimum values of the input signal are found at each sampling interval and the waveform is displ...

Page 26: ...tion grid brightness and waveform brightness Press the DISPLAY key to enter the display menu Display menu Descriptions Display level on time scale Display Lissajous graph of CH1 CH2 waveforms Using lines to display between samples Displays points directly waveform on screen refreshs with normal refresh rate The waveform data on the screen refreshs after specified time The waveform data on the scre...

Page 27: ...Y Mode The phase difference between the two signals of the same frequency can be easily observed by Lissajous method The following chart gives the observation of phase difference Since sinθ A B or C D theta θ is the angle between the two signals the definition of A B and C D is shown above We can draw a difference angle θ arcsin A B or θ arcsin C D If the principal axis of an ellipse is in quadran...

Page 28: ... All Parameters User Defined Indicator Advanced measurement Measurement statistics Reset statistics Clear Advanced measurement menu Descriptions Delay measurement Phase measurement FRR time between the first rising edge of source 1 and the first rising edge of source 2 FRF time between the first rising edge of source 1 and the first falling edge of source 2 FFR time between the first falling edge ...

Page 29: ... the lowest point with respect to GND Vtop Highest stable voltage Vbase Lowest stable voltage Middle Midpoint between highest and lowest stable voltage Vpp Vmax Vmin Vamp Vtop Vbase Mean Average amplitude of the waveform on screen CycMean Average amplitude of a waveform in one period RMS The effective value According to the energy produced by the AC signal in the conversion the equivalent energy t...

Page 30: ...ge of source 2 LRF Time between the last rising edge of source 1 to the last falling edge of source 2 LRR Time between the last rising edge of source 1 to the last rising edge of source 2 LFR Time between the last falling edge of source 1 to the last rising edge of source 2 LFF Time between the last falling edge of source 1 to the last falling edge of source 2 8 5 User defined parameters Press the...

Page 31: ...edge of adjacent cycles then BX AX is the signal s period and 1 BX AX is the frequency The voltage value can also be displayed at cursor s current position That is AY BY and BY AY The Multipurpose knob can be used to adjust the BX and AX positions when setting is set to trace mode with using the F2 key 9 2 Voltage Measurement The method for voltage measurement is similar to the method for time mea...

Page 32: ...the oscilloscope Data will be saved on USB drive Saves settings to selected disk Call back previously saved settings returns the oscilloscope to the previously saved setting state Options Storage Setting CH1 CH2 DSO USB Functions Type Source Disk Save Callback Remarks Oscilloscope can only select USB device when U disk or other external storage devices are plugged in Callback only works when previ...

Page 33: ...ed when external USB storage devices are connected Chapter 11 Auxiliary Function Setting Press the UTILITY key to enter the auxiliary function settings menu Auxiliary function setting menu 1 Descriptions Enter system configuration page Enter interface configuration page Enter pass test page Enter wave record page Enters Auxiliary function setting menu 2 Functions System configuration Interface con...

Page 34: ...turn UTILITY root directory Functions Factory settings Contrast ratio Screen protection Return Close 1 minute 5 minutes 10 minutes 30 Minutes Options Time menu setting Descriptions Control display Selected via the F2 button use Multipurpose key to adjust Selected via the F3 button use Multipurpose key to adjust Selected via the F4 button use Multipurpose key to adjust Make the modification to be v...

Page 35: ...n the rear panel output pulse signal and produce buzzing when failure et the Pass Fail interface on the rear panel output pulse signal and produce buzzing when pass Set the source of the pass test Turn off display information Turn on display information Enter Pass Test Menu 2 Options Close Open Fail Pass CH1 CH2 Close Open Functions Allow Test Output Source Display Info Pass Test Menu 2 Descriptio...

Page 36: ...Set the source press F3 to set the source to CH1 Template settings press F5 to enter the next page then press F3 to enter the template settings menu Press F1 to select the reference waveform to CH1 press F2 and F3 set the level threshold with the multipurpose knob to 10 set the vertical threshold to 5 then press F4 to create a template press F5 to return to the test menu Stop setting press F2 to e...

Page 37: ...h of record Interval of record End frame After setting up the record parameter Press F1 to select the waveform record operation and perform the waveform record Waveform record operation menu Descriptions Recording playback stop etc Playback of recorded waveform Stop recording or playing back waveform Perform recording waveform Quickly perform recording waveform unable to view the current record wa...

Page 38: ... square wave Sawtooth wave Triangular wave Pulse wave Functions Output waveform Setup Waveform generator menu 2 Descriptions Use Multipurpose key to adjust signal frequency Use Multipurpose key to adjust signal amplitude Use Multipurpose key to adjust signal Shifting Modify Pulse width for pulse signal Modify duty cycle for square wave signal Modify symmetry for sawtooth wave Functions frequency a...

Page 39: ... files range profile and triggering parameters so that the waveform automatically properly displays on the screen Press the AUTO key to enable automatic settings Automatic setting is suitable for setting up simple single frequency signals and not for complex combination waves The signal frequency is not less than 50Hz the amplitude is not less than 30mVpp and the square wave duty cycle is more tha...

Page 40: ...ype Format Duration Time Grid Brightness Waveform Brightness Storage Type Frequency Meter Measurements Cursor Language Menu Display Square wave output Backlight brightness Output selection Display Other System Chapter 13 System prompt and Troubleshooting 13 1 System Information Description Operation at limit In the current state adjustment has reached the limit and cannot continue When the vertica...

Page 41: ...gger menu and confirm that the signal and channel are consistent Check the trigger type normal signals should use edge trigger mode Stable waveform will be displayed only by setting to the correct trigger mode Try changing the trigger coupling to high frequency or low frequency in order to suppress or remove noise caused by interference 5 Pressing the RUN STOP key and no waveform is displayed Chec...

Page 42: ...re trigger Negative Delay 1 Screen Width Post trigger Positive Delay 1 s 50 s YT XYROLL Timing Scale Timing Accuracy Delay Timebase Horizontal Vertical Model Bandwidth Rise Time Typical Channels 4 Sampling or average sampling method DC to maximum bandwidth 40 dB Teal time Sampling Equivalent sampling 1GS s Single Channel 500MS s Dual Channel Sampling peak detection high resolution envelope and ave...

Page 43: ...0s Under range Pulse Trigger Pulse Condition Polarity Pulse Width Range Positive negative 20ns 10s Voltage between cursors V Time between cursors T Frequency Hz 1 T Voltage and time at waveform point Allows auto display of cursor Manual Trace Mode Indicator Cursor Supports NTSC PAL rows range is 1 525 NTSC and 1 625 PAL SECAM Video Trigger Signal System Frequency Range Measure Positive slope great...

Page 44: ...t Number Measurement Range Split screen time base can be adjusted independently Low pass High pass Band pass Mathematical Operations Waveform Calculation FFT Window Type FFT Display FFT Vertical Scale Digital Filter Internal 20 External USB Internal 20 External USB External USB Storage Setting Waveform Bitmap 8 inch TFT LCD 800 horizontal 480 vertical RGB 160 000 000 Auto Short afterglow Long afte...

Page 45: ...ludes manual and application software Standard accessories MODE For all accessories standard and optional please order at UNI T local dealers Appendix B Maintenance and Cleaning 1 General Maintenance Do not store or place the instrument and liquid crystal display in direct sunlight Caution do not spray liquid or solvent on the instrument or probe 2 Clean Refer to the operating conditions of the in...

Page 46: ... applicable insurance guarantee Uni T does not provide any other explicit or implied guarantee including but not limited to the product trading and special purpose for any implied warranties In any case UNI T for indirect special or consequential loss does not bear any responsibility Appendix D Contact Us If the use of this product has caused any inconvenience you can contact Uni Trend Technology ...

Page 47: ......

Reviews: