


Fig. 3 0 shows a graphical development of a similarly
tilted square wave. The tilt is seen to be caused by the
strong influence of the phase-shifted 3rd harmonic. It also
becomes evident thar very slight shifts in phase are quickly
shown up by tilt in the square wave.
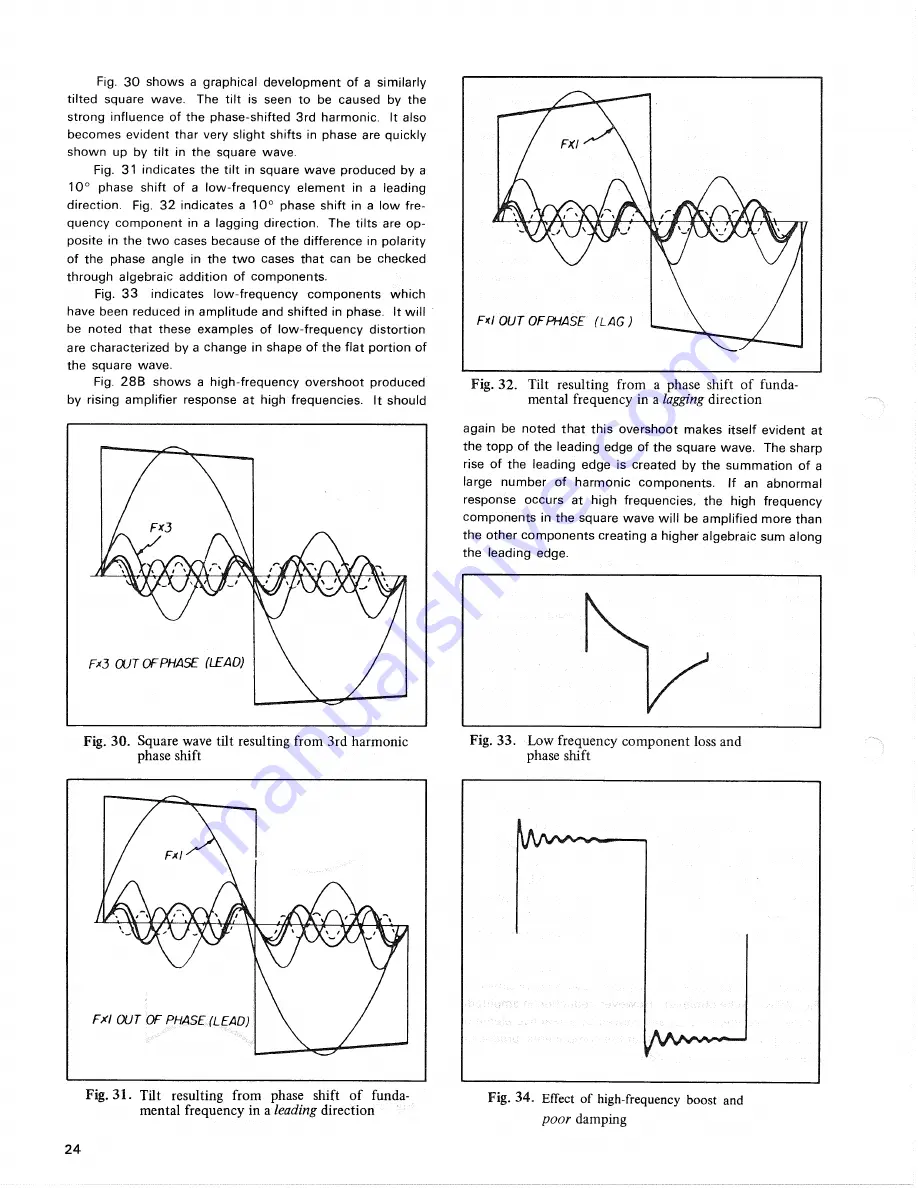
Fig. 31 indicates the tilt in square wave produced by a
10° phase shift of a low-frequency element in a leading
direction. Fig. 3 2 indicates a 10° phase shift in a low fre-
quency component in a lagging direction. The tilts are op-
posite in the two cases because of the difference in polarity
of the phase angle in the two cases that can be checked
through algebraic addition of components.
Fig. 3 3 indicates low-frequency components which
have been reduced in amplitude and shifted in phase. It will
be noted that these examples of low-frequency distortion
are characterized by a change in shape of the flat portion of
the square wave.
Fig. 28B shows a high-frequency overshoot produced
by rising amplifier response at high frequencies. It should
again be noted that this overshoot makes itself evident at
the topp of the leading edge of the square wave. The sharp
rise of the leading edge is created by the summation of a
large number of harmonic components. If an abnormal
response occurs at high frequencies, the high frequency
components in the square wave will be amplified more than
the other components creating a higher algebraic sum along
the leading edge.
Fig. 30. Square wave tilt resulting from 3rd harmonic
phase shift
Fig. 33. Low frequency component loss and
phase shift
Fig. 3 1 . Tilt resulting from phase shift of funda-
mental frequency in a
leading
direction
Fig. 34. Effect of high-frequency boost and
poor
damping
24
FKI
F*l OUT OF PHASE (LAG)
Fig. 32. Tilt resulting from a phase shift of funda-
mental frequency in a
lagging
direction
Fx3
F*3 OUT OF PHASE (LEAD)
Fxl-
FXI OUT OF PHASE (LEAD)


