


2. The second is non-linear distortion and refers to a
change in waveshape produced by application of the
waveshape to non-linear elements such as vacuum
tubes, an iron core transformer or a clipper network.
3. The third is delay or phase distortion, which is distor-
tion produced by a shift in phase between some com-
ponents of a complex waveform.
In actual practice, a change in amplitude of a square
wave compnent is usually caused by a frequency selective
network which includes capacity, inductance or both. The
presence of the C or L introduces a difference in phase angle
between components, creating phase distortion or delay dis-
tortion. Therefore, in square wave testing of practical cir-
cuitry, we will usually find that the distorted square wave in-
cludes a combination of amplitude distortion and phase dis-
tortion.
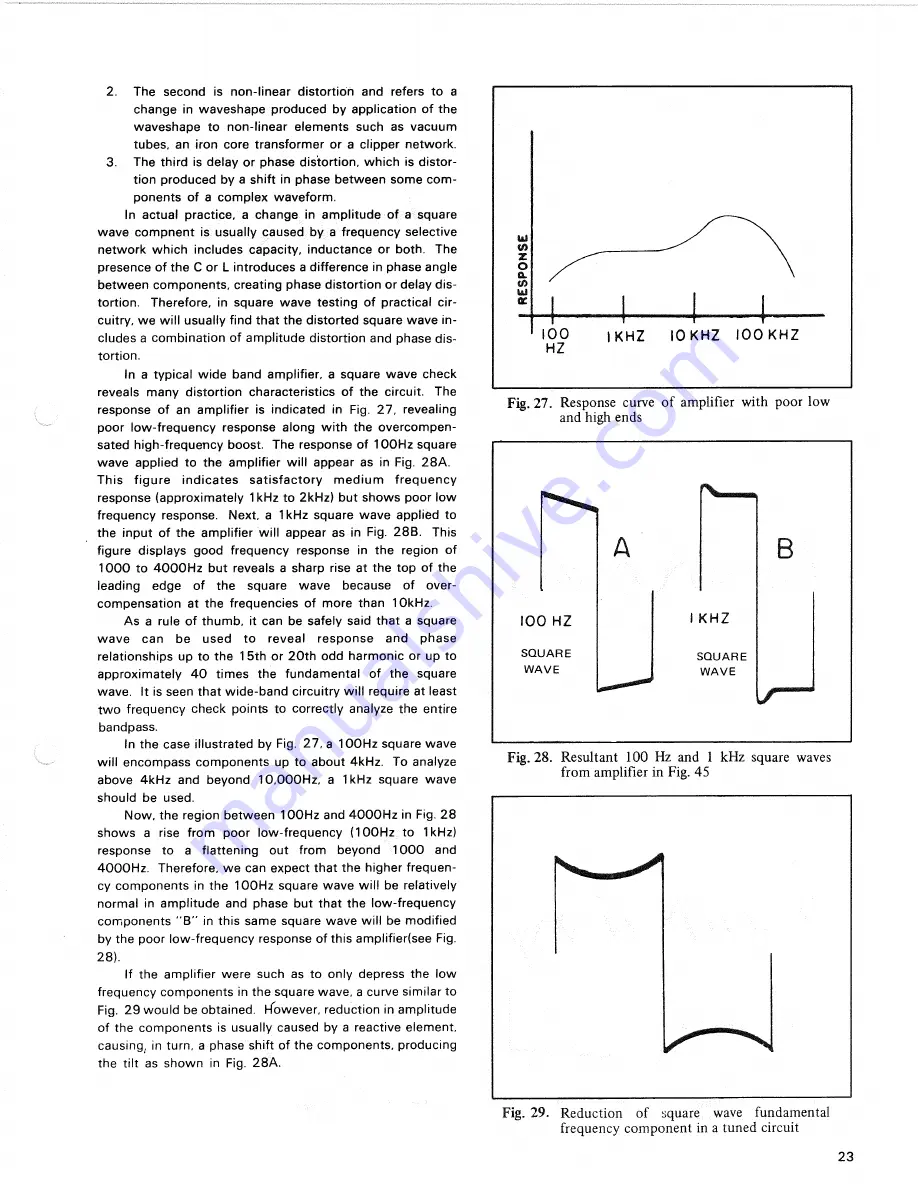
In a typical wide band amplifier, a square wave check
reveals many distortion characteristics of the circuit. The
response of an amplifier is indicated in Fig. 27, revealing
poor low-frequency response along with the overcompen-
sated high-frequency boost. The response of 100Hz square
wave applied to the amplifier will appear as in Fig. 28A.
This figure indicates satisfactory medium frequency
response (approximately 1kHz to 2kHz) but shows poor low
frequency response. Next, a 1kHz square wave applied to
the input of the amplifier will appear as in Fig. 28B. This
figure displays good frequency response in the region of
1000 to 4000Hz but reveals a sharp rise at the top of the
leading edge of the square wave because of over-
compensation at the frequencies of more than 10kHz.
As a rule of thumb, it can be safely said that a square
wave can be used to reveal response and phase
relationships up to the 1 5th or 20th odd harmonic or up to
approximately 4 0 times the fundamental of the square
wave. It is seen that wide-band circuitry will require at least
two frequency check points to correctly analyze the entire
bandpass.
In the case illustrated by Fig. 27, a 100Hz square wave
will encompass components up to about 4kHz. To analyze
above 4kHz and beyond 10,000Hz, a 1kHz square wave
should be used.
Now, the region between 100Hz and 4000Hz in Fig. 28
shows a rise from poor low-frequency (100Hz to 1kHz)
response to a flattening out from beyond 1 0 0 0 and
4000Hz. Therefore, we can expect that the higher frequen-
cy components in the 100Hz square wave will be relatively
normal in amplitude and phase but that the low-frequency
components " B " in this same square wave will be modified
by the poor low-frequency response of this amplifier(see Fig.
28).
If the amplifier were such as to only depress the low
frequency components in the square wave, a curve similar to
Fig. 29 would be obtained. However, reduction in amplitude
of the components is usually caused by a reactive element,
causing, in turn, a phase shift of the components, producing
the tilt as shown in Fig. 28A.
Fig.
27.
Response curve of amplifier with poor low
and high ends
Fig.
28.
Resultant
100
Hz and
1
kHz square waves
from amplifier in Fig. 45
Fig.
29.
Reduction of square wave fundamental
frequency component in a tuned circuit
23
1 0 0 H Z
S Q U A R E
W A V E
I K H Z
S Q U A R E
W A V E


