49
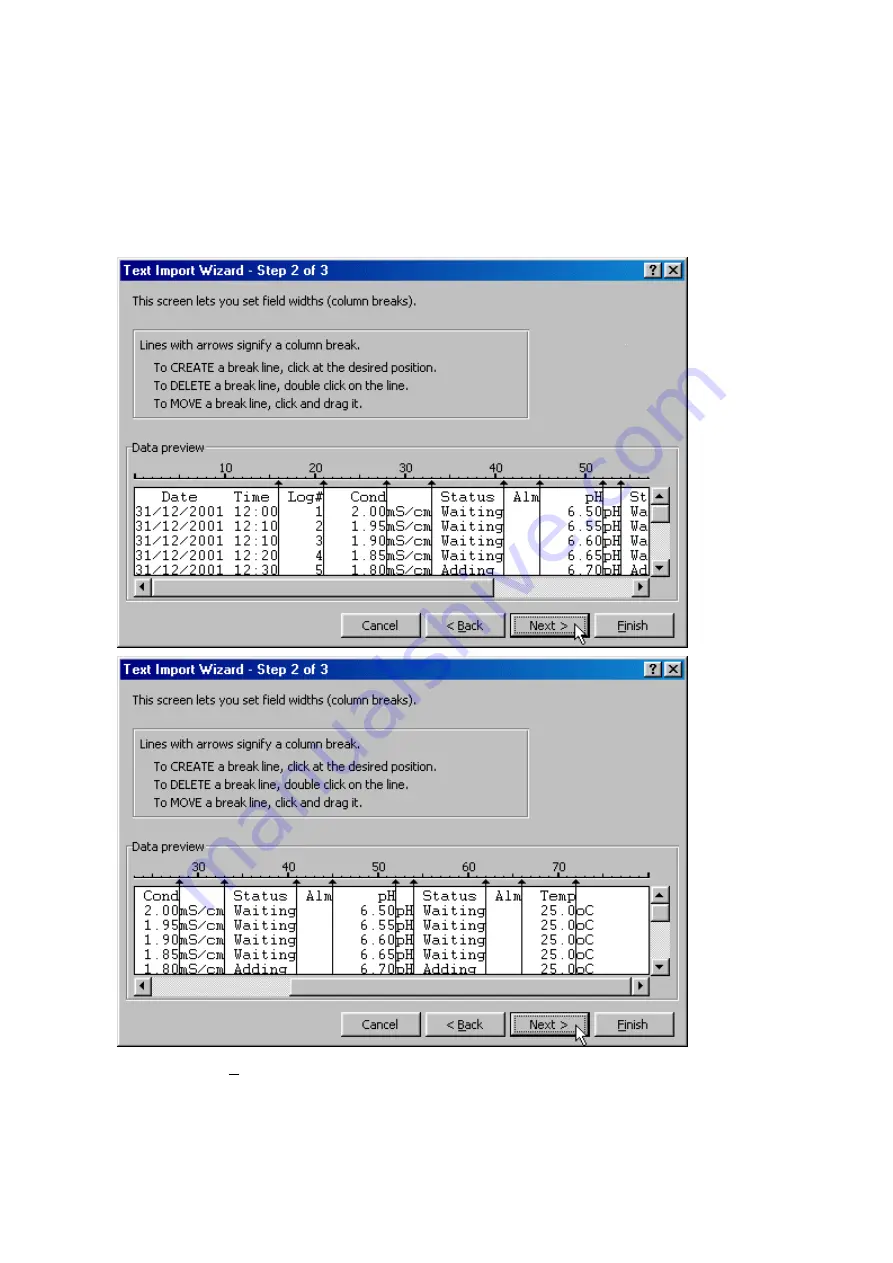
5. Step 2 of the Text Import Wizard allows you to select the points at which each data field will
break into a new column. The sample screens below show where TPS recommends the breaks
be inserted. There are two screens, as the width of the data requires the window to be scrolled
over.
The date and time have been incorporated into a single column to ensure that the X-axis is
correctly formatted if the data is to be charted later.
Press “Next >” after all the column breaks have been inserted.
6. Simply press “Finish” at step 3 of the Text Import Wizard. TPS recommends that the data
format for each column be set once the data is in spreadsheet format.
For help on formatting the data columns, charting, graphing or other operations please consult
the Microsoft
Excel
help file. Alternatively please contact TPS and we will try to provide
further assistance.


