F. ADDITIONAL APP FEATURES
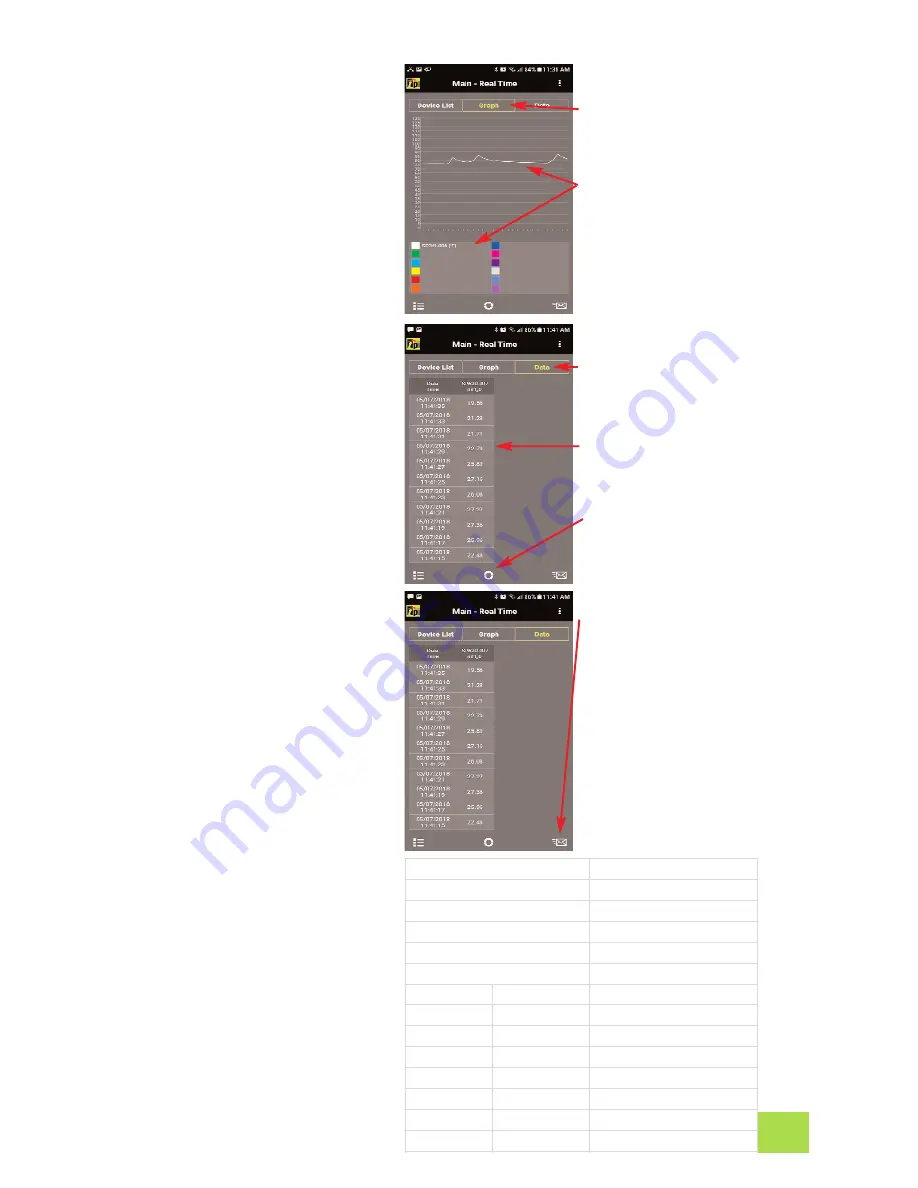
1. Tapping “Graph” switches the
display to graph mode. The tem-
perature will be displayed as a
line graph.
If multiple SP620’s are being
used, each will have a different
color in the App.
2. Tapping “Data” switches the dis-
play to show the measured data
in a list format.
Each reading in the list will be
dated and time stamped.
Tap “Data”.
The measurement data is
shown in a list with a date
and time stamp.
Tapping the Refresh icon
clears this data.
Tap the mail icon.
Test data will be exported in
a CSV file via email.
Company Name :
Test Products Intl
Company Address :
9615 SW Allen Blvd
Customer Name :
Sample Customer
Customer Address :
1111 Sample Way
Building Name :
Bldg 3
Building Address :
1222 Sample Ave
Date
Time
SP620-007(inH2O)
5/7/2018
11:44:01
20.55
5/7/2018
11:43:59
20.74
5/7/2018
11:43:57
20.61
5/7/2018
11:43:55
21.03
5/7/2018
11:43:53
21.13
5/7/2018
11:43:51
21.4
4. Exported data in the CSV file dis-
play with the date and time
stamp.
If a company and customer name
has been entered they will be
exported too. See page 5 for set-
ting up the customer and compa-
ny name.
Tap “Graph”.
Each SP620 is displayed in a
different color in the line
graph.
3. Tapping the mail icon enables
test data to be exported in a CSV
file via email.
5
Summary of Contents for SP620
Page 14: ...NOTES ...
Page 15: ...NOTES ...


