25
T-Cube NanoTrak Autoalignment Controller
Fig. 5.1 Typical User Screen
The Kinesis software will be used throughout the rest of this tutorial to interface with
the position aligner.
Page 1: ...TNA001 IR T Cube NanoTrak Controller Kinesis User Guide Original Instructions ...
Page 2: ... Baseplate 12 3 3 Electrical Installation 13 3 3 1 Description of Input Output Connections 13 3 3 2 Supply Voltage and Current Requirements 14 3 3 3 Connecting To A Standalone Power Supply 14 3 3 4 Using The USB Controller Hub 15 3 3 5 Detector Heads and Cables 16 Chapter 4 Using the NanoTrak Without A PC 17 4 1 Introduction 17 4 1 1 System Overview Fiber to Fiber Alignment Example 17 4 2 Control ...
Page 3: ...3 5 Basic Operation 32 5 3 6 Using Two NanoTraks in the Same System 36 5 4 Programmed Operation 38 5 5 Setting Sequences 38 5 6 Changing and Saving Parameter Settings 38 Chapter 6 Software Reference 39 6 1 GUI Panel 39 6 2 NanoTrak Settings Window 43 6 2 1 Tracking tab 43 6 2 2 Input Output tab 46 6 2 3 Display Tab 50 Appendices Appendix A Connector Pinout Details 52 Appendix B Preventive Maintena...
Page 4: ...n a manner not specified by the manufacturer the protection provided by the equipment may be impaired In particular excessive moisture may impair operation Spillage of fluid such as sample solutions should be avoided If spillage does occur clean up immediately using absorbant tissue Do not allow spilled fluid to enter the internal mechanism Caution If your PC becomes unresponsive e g due to an ope...
Page 5: ...p NanoTrak Controller BNT001 to achieve high efficiency optical coupling in photonics alignment applications The units are shipped with an InGaAs detector for infra red wavelengths A silicon visible wavelength detector NTA009 is available separately Operator interaction can be accomplished via th e manual control panel via the intuitive software interface provided with the unit or via the software...
Page 6: ...ompact two way power supply unit TPS002 is available from Thorlabs allowing up to 2 K Cube Piezo Drivers to be powered from a single mains outlet This power supply unit is also designed to take up minimal space and can be mounted to the optical table in close proximity to the driver units connected via short power leads As a further level of convenience when using the T Cube Controllers Thorlabs a...
Page 7: ...sitioning applications very rapidly and with great ease The server is described in more detail in the following section 2 3 2 Kinesis Server Kinesis controls are re usab le compiled software compo nents that supply both a graphical user interface an d a p rogrammable interface Many such Controls a re available for Windows applications development providing a large range of re usable functionality ...
Page 8: ...the current operating state of the controller unit to which it is associated e g such as range and relative power Updates to the panel take place automatically when a user client application is making software calls into the same Control For example if a client application instructs the associated NanoTrak Control to track the position of maximum power progress is mo nitored automatically by chang...
Page 9: ...e main Kinesis Soft ware online help file for a co mplete programmers guide This is available either by pressing the F1 key when running the Kinesis server or via the Start menu Start Programs Thorlabs Kinesis Kinesis Help 2 3 3 Software Upgrades Thorlabs operate a policy of continuous product development and may issue software upgrades as necessary The latest software can be downloaded from the s...
Page 10: ...gh intuitive graphical user interface panels GUIs which expose all key operating parameters and modes The user can select multiple panel views displaying different information about a particular hardware unit The multitasking architecture ensures that the graphical control panels always remain live showing all current hardware activity Caution Some PCs may have been configured to restrict the user...
Page 11: ...aseplate fitted ready to be bolted to a breadboard optical table or similar surface If desired the baseplate can be removed and the unit can be stood on rubber feet see Section 3 2 3 For multiple cube systems a 3 channel and 6 channel K Cube Controller Hub KCH301 and KCH601 are also available see Section 2 2 for further details Full instructions on the fitting and use of the controller hub are con...
Page 12: ... unit to the baseplate Retain the bolts for future use if the baseplate is refitted 1 Turn the unit upside down 2 Remove the backing paper from the rubber feet supplied taking care not to touch the exposed adhesive surface 3 Position the feet as desir ed then press and hold for a few seconds until the adhesive has bonded 4 The unit may now be used freestanding sitting on its rubber feet Detail A D...
Page 13: ...SMA connector Used to receive a signal of optical power from an external power meter 0 to 10V range 1MΩ input impedance LV OUT CH1 and LV OUT CH2 SMA connector 0 to 10V When the unit is used off the hub these outputs are connected to the EXT IN connectors on the associated Piezo Drivers see Section 4 3 1 and Section 5 3 When the unit is used with the TCH002 hub see Section 5 3 2 these outputs can ...
Page 14: ...14 5V 15 5V 250 mA 15V 14 5V 15 5V 100 mA Warning The unit must be connected only to a DC supply as detailed in Section 3 3 2 Connection to a supply of a different rating may cause damage to the unit and could result in injury to the operator Caution Do not connect the T Cube unit to a live external power supply Doing so i e hot plugging carries the risk of PERMANENT damage to the unit Always ensu...
Page 15: ...rnally the Controller Hub contains a fully compliant USB 2 0 hub circuit to provide communications for all K Cubes a single USB connection to the Controller Hub is all that is required for PC control The Controller Hub also provides power distribution for the K Cubes requiring only a single power connection In order to fit the NanoTrak T Cube on the hubs and adapter KAP101 is required and these ar...
Page 16: ...sfer of voltage signals between T Cubes with two available analog lines This is used by the KPZ101 Piezo Cube and KSG101 Strain Gauge Cube to route a feedback signal via the Hub for closed loop operation It is also used by the TNA001 Nanotrak Cube to send position demand signals to a pair of slave KPZ101 Piezo Cubes A clash can occur if a KSG101 Strain Gauge Cube and a TNA001 NanoTrak Cube are com...
Page 17: ...h thatmaximum power transfer is obtained Fig 4 1 Typical Stand Alone Set Up The NanoTrak produces two sinusoidally varying outputs with 90 phase shift i e sine and cosine which when applied to the piezo stage move the input optical fiber in a circular path DC o ffsets on these outputs are altered by the NanoTrak unit to move the center position of the circular path i e fiber in Y and Z space The u...
Page 18: ...ntrols and Indicators MODE AUTO Button se lects and de selects the Auto Rang ing mode see Section 4 2 2 LATCH TRACK Button used to toggle between LATCH and TRACK modes of operation see Section 4 2 1 LATCH LED lit when the unit is in LATCH mode seeSection 4 2 1 RANGE Bar displays the current range of the internal power meter Available ranges vary from 30 nanoamps range 1 to 10 milliamp range 12 Not...
Page 19: ...when range changes would be undesirable When the auto ranging mode is selected range changes occur whenever the relative input power signal reaches the upper or lower end of the currently set range 4 3 Building An Auto alignment System Stand Alone Operation 4 3 1 Wiring and Initial Set Up The following procedure describes a typical set up with the TNA001 NanoTrak cube being used with a pair of KPZ...
Page 20: ...adings shown on the RANGE and SIGNAL bars Since the optical source has been removed these readings show the level of background noise present 3 Use the manual X axis actuator to bring the fiber tips close together 4 Adjust the manual Y and Z axis actuators to visually align the fibers when viewed from the side and above 5 Carefully adjust the manual Y and Z axis actuators while observing the range...
Page 21: ...le the input source is a TIA PIN type detector and in this case the bar display indicates the power level in Amps with respect to the currently applied range e g if the range is 1mA Range 10 then a bar displaying half length equates to a current power level of 0 5mA 6 Continue to adjust the manual actuators until the RANGE and SIGNAL bars show a significant increase in the p ower level i e well ab...
Page 22: ...D is lit to the right of the target This indicates that the horizontal piezo actuator is towards the right hand side of its travel The piezo driver associated with the horizontal actuator will show around 60V assuming a 75V piezo for a 150V piezo a typical value will be around 120V Now suppose that after a few minutes the power signal increases and the red LED to the right of the target is lit Thi...
Page 23: ...r together The RANGE and SIGNAL bars should show significant increase in the power level Typically the Y and Z manual actuators will need re adjusting to bring the Target display to the center position 4 4 Using an External Power Meter Power meters are available that may give greater sensitivity and accuracy than the integral power meter of theNanoTrak The output of the detector should be connecte...
Page 24: ...its connected to the PC USB Bus This program allows multiple graphical instrument panels to be displayed so that multiple units can be controlled All basic operating parameters can be set through this program and all basic operations such as piezo moves can be initiated This tutorial shows how the Kinesis application provides all of the functionality necessary to operate the hardware Power up the ...
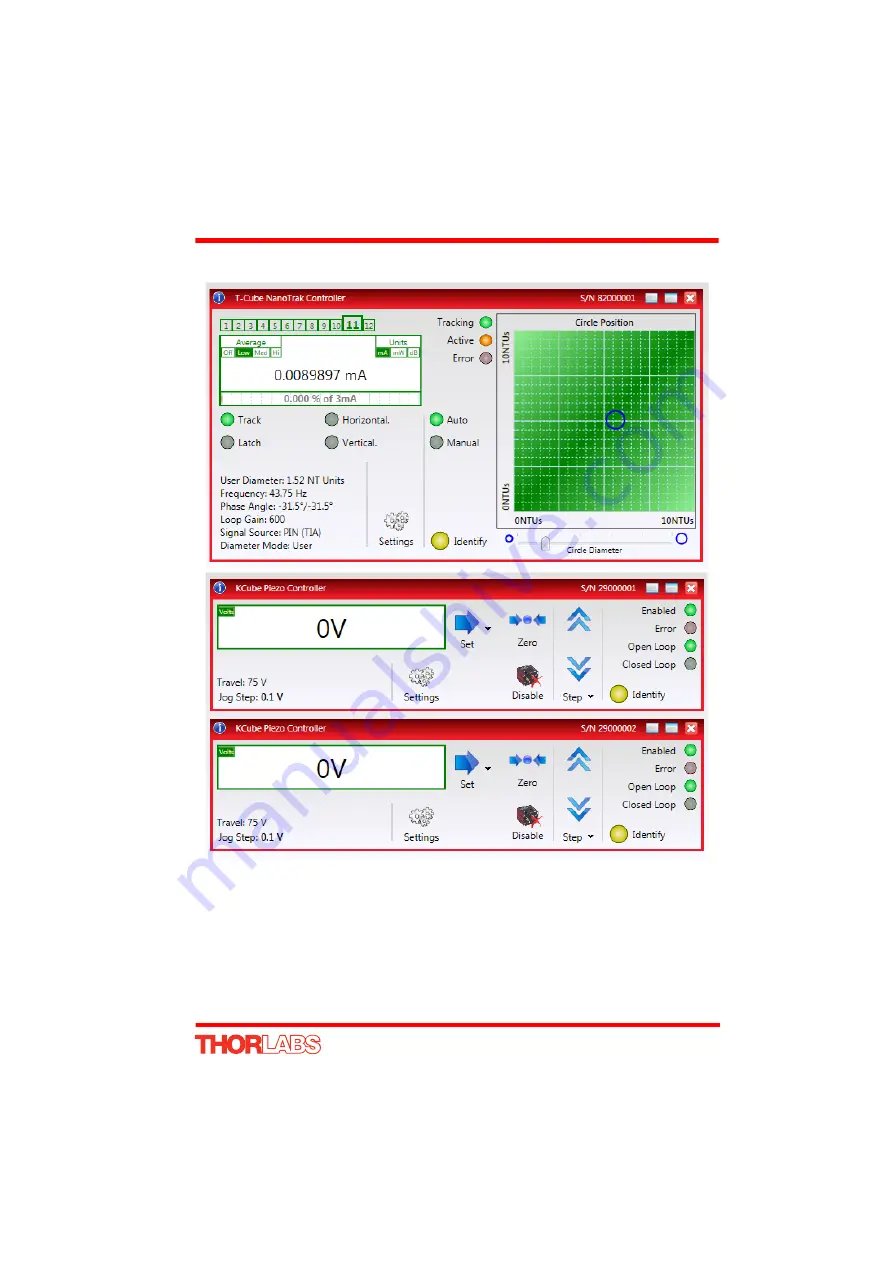
Page 25: ...25 T Cube NanoTrak Autoalignment Controller Fig 5 1 Typical User Screen The Kinesis software will be used throughout the rest of this tutorial to interface with the position aligner ...
Page 26: ... controller hub see Fig 5 2 for a general system schematic diagram A TLS001 laser source cube is also shown though this cou ld be substituted wi th any laser source Th e T Cube positions on the hub and associated parameter settings described are by no means the only possible options For further information see Section 5 3 3 1 Perform the mechanical installation as detailed in Section 3 2 of this m...
Page 27: ... Wait while WindowsTM installs the drivers for the new hardware see the Getting Started guide for more information 11 Run the Kinesis software Start All Programs Thorlabs Kinesis Kinesis 12 Click the Settings button on GUI of the Piezo Driver fitted in bay 1 The Settings panel is displayed Note To identify the piezo unit associated with a GUI panel click the Ident button the Power LED on the panel...
Page 28: ...l to give a reading of 0V on the display 17 Click the Settings button on GUI of the Piezo Driver fitted in bay 2 The Settings panel is displayed Make the following parameter settings as shown in Fig 5 3 Output Voltage Range Set the corresponding voltage for the piezo being driven 75V 100V or 150V Input Settings Select Software External Signal Analogue Input Input Mode Select Analogue Channel 2 Loo...
Page 29: ...ab see Fig 5 4 21 Make the following parameter settings as shown in Fig 5 4 Input Signal Source Select PIN TIA Input Voltage Range Select 10V Range Voltage Routing Select SMA Hub 22 If desired click the Persist Settings To Hardware box These settings will then be loaded on each power up cycle Fig 5 4 NanoTrak Settings 23 Click OK to save the settings ...
Page 30: ...Source EXT IN parameter in the piezo settings panel depends on the bays in which the piezo and NanoTrak units are fitted The various bay options and their associated Analogue Input Source EXT IN settings are described in Fig 5 6 5 3 4 Wiring and Software Settings for Standalone Operation Using the KCH hub greatly simplifies system wiring because the hub provides all the necessary power signal and ...
Page 31: ...ATCH TRACK SIGNAL RANGE 1 2 3 4 5 6 7 8 9 101112 POWER LATCH MODE LATCH TRACK SIGNAL RANGE 1 2 3 4 5 6 7 8 9 101112 bay 1 TPZ001 Hub Channel 2 bay 3 TPZ001 Hub Channel 1 bay 2 TPZ001 Hub Channel 2 bay 2 TPZ001 Hub Channel 1 bay 4 TPZ001 Hub Channel 2 bay 3 TPZ001 Hub Channel 1 X D D D Piezo Controller MENU Piezo Controller MENU Piezo Controller MENU Piezo Controller MENU Piezo Controller MENU Piez...
Page 32: ...it 3 Set the Scan Circle Diameter control to about mid range 4 Press the Auto button to select Auto Ranging mode 5 Using the manual X axis actuator position the stage such tha t the input and output fibers are spaced well apart with zero power transmission between them Alternatively switch off or obscure the optical power source Make a note of the readings shown on the Range and Relative Signal ba...
Page 33: ...e bar display indicates the power level in Amps with respect to the currently applied range e g if the range is 1mA Range 10 then a bar displaying half length equates to a current power level of 0 5mA Note If the input source is set to SMA voltage for use with an external power meter then the bar display indicates the voltage being measured 10V full scale e g for an input voltage of 5V the bar dis...
Page 34: ...and RANGE bars For example consider the situation when the RANGE bar indicates 5 and the SIGNAL bar is 2 3 lit This shows that the power level is about 2 µA Let s also assume that the circle is to the right of the display as shown below This indicates that the horizontal and vertical piezo actuators are towards the right hand and upper ends of their travel The piezo drivers associated with the act...
Page 35: ...3 The position of peak power is located when a stable power reading is displayed on the Range and Signal bars and the circle shows a stable piezo position 14 Adjust the Y and Z axis manual actuators as necessary to return the piezos to the mid range position i e circle in center of display 15 Optimize the power reading by adjusting the X axis manual actuator to bring the fiber tips closer together...
Page 36: ...ate channel To set up a two NanoTrak system 1 Make connections as shown in Fig 5 8 2 Power up the NanoTrak units 3 Run Kinesis software 4 In the input NanoTrak GUI select Settings 5 Select the Tracking tab then set the Circle User Frequency e g 40 Hz 6 Select the Input Output tab then set the Input Signal Source to PIN TIA 7 In the output NanoTrak GUI select Settings 8 Select the Tracking tab then...
Page 37: ...l waveguide 4 channel waveguide 1 to 4 channel splitter SAFETY KEYSWITCH POWER mW mA dBm MODE OK OUTPUT TCH001 USB Controller Hub fitted with Qty 4 KPZ101 Piezo Driver Qty 2 TNA001 NanoTrak TLS001 Laser Source LV OUT CH1 LV OUT CH2 OPTICAL PIN IN SIG IN LV OUT CH1 LV OUT CH2 OPTICAL PIN IN SIG IN KPZ101 TNA001 KPZ101 KPZ101 TNA001 KPZ101 Optical Splitter ...
Page 38: ...re allows sequences to be programmed allowing several operations to be performed wi thout user intervention For more details and instructions on setting sequences please see the Kinesis Helpfile 5 6 Changing and Saving Parameter Settings During operation certain settings e g operating mode etc can be changed as required and saved to the device for use in the absence of a PC However when the device...
Page 39: ... toggle between auto and manual ranging The LED in the button is lit when selected Digital Display shows the feedback signal level being measured Display Units show the measurement units associated with the display If a PIN TIA inp ut signal is connected input source is set to TIA mode using the SetInputSrc method the display can be configured to display mA mW or dB If mA is selected readings are ...
Page 40: ...layed on the GUI Settings of low medium and high resulting in averaging numbers of 5 10 a nd 20 respectively At the default display update rate of 10Hz this translates to 0 5 1 and 2 second time constants respectively This setting is provide d as a conve nient way of smoothing readings displayed on the GUI only and does not affect in any way those same readings when returned by software messages T...
Page 41: ... voltage input Circle Position display sh ows the p osition of th e scan circle wh ich in turn corresponds to the horizontal and vertical position of the piezo actuators The width and height of the display is 10 NanoTrak NT units each division being 1 10th of the max piezo travel e g for a 20µm piezo travel 1 NT unit 2µm The CRT also displays the settings currently applied for the following parame...
Page 42: ...e Settings panel or by calling the SetInputSrc method continued on next page Circ Dia Adj Mode displays the mode of circle diameter adjustment as follows SW user Diameter adjusted through software LUT Diameter adjusted via Look Up Table see SetCircDiaLUTVal and SetCircDiaMode methods Settings button Displays the Setting s panel which allows the NanoTrak s operating parameters to be entered see Sec...
Page 43: ...ak makes 43 75 circular movements per second Different frequency settings allow more than one NanoTrak to be used in the same alignment scenario Refer to Section 5 3 6 for more information Diameter Mode this setting allows the different modes of circle diameter adjustment to be enabled and disabled If the Diameter Mode is set to User the circle diameter remains at the value set by the user in the ...
Page 44: ...e phase shifts around the loop and thereby effect the system stability These phase shifts can be cancelled by setting a Phase Compensation factor Horizontal the phase compensation for the horizontal component of the circle path Vertical the phase compensation for the vertical component of the circle path The values can be specified in the range 180 0 to 180 0 degrees and typically are set equal to...
Page 45: ...hese settings are applied automatically This is particularly important when the driver is being used manually in the absence of a PC and USB link The User Diameter and Frequency parameters described previously is a good example of a setting that can be altered and then persisted in the driver for use in absence of a PC To save the settings to hardware check the Persist Settings to Hardware checkbo...
Page 46: ...e TIA trans impedance amplifier input source should be selected when using the rear panel Optical I P connector or when an external detector head is connected to the optional SMB connector This option uses the internal amplifier circuit and associated functionality e g autoranging The 10V SMA Input options should be used when NanoTraking to optimize a voltage feedback signal Typically these inputs...
Page 47: ...by the NanoTrak and is a pplicable only if the SMA SIG IN inp ut source has been specified If Voltage is selected readings are displayed or returned in Volts i e the raw input signal to the SMA connector If Full Range is sel ected readings are displayed or returned as a percentage of full scale input e g a 5V signal will display a value of 50 If User Defined is selected readings are displayed or r...
Page 48: ... save the settings to hardware check the Persist Settings to Hardware checkbox before clicking the OK button Input Signal Amplifier TIA Autoranging Settings These settings are used to modify the autoranging and output characteristics of the NanoTrak input amplifier circuit Trans impedance amplifier TIA circuit Auto ranging Mode when auto ranging mode is selected on the GUI panel range changes occu...
Page 49: ...from 2 to 32 with a default setting value of 4 Low Pass Filter This setting specifies the cut off freq uency of the digital low pass LP filter applied to output readings of the internal amplifier TIA circuitry If the readings displayed or returned are unstable this setting can be used to remove any unwanted high frequency components and improve input signal stability NONE Low pass filter inactive ...
Page 50: ... This feature allows manual repositioning of the piezos e g to enable investigation of the region of interest to look for side peaks artifacts etc The circle can be moved either by click and drag or b y moving an incremental distances per mouse click Note The circle can be moved in both Latch and Tracking modes Display Units The Circle Position display shows the circle d iameter and the horizontal...
Page 51: ...to microns the limits are dependent upon the travel of the piezo actuator see the Circle Calibration parameter Circle Calibration If the Display Units parameter is set to microns the Horizontal and Vertical Circle Move Increment limits are dependent upon the travel of the piezo actuator This parameter is used by the NanoTrak to calculate the incremental limit per click e g the NanoTrak screen is 1...
Page 52: ... can result in the sen sitive electronic inside the cube getting damaged invalidating warranty The cube uses a standard mini DIN type of input connector the corresponding plug is available from most standard electronics suppliers Fig A 1 shows the mini DIN socket as viewed by looking at the rear panel of the cube The pin numbering follows the standard for mini DIN connectors Fig A 1 POWER Connecto...
Page 53: ...arts There is a risk of electrical shock if the equipment is operated with the covers removed Only personnel authorized by Thorlabs Ltd and trained in the maintenance of this equipment should remove its covers or attempt any repairs or adjustments Maintenance is limited to safety testing and cleaning as described in the following sections Warnings Disconnect the power supply before cleaning the un...
Page 54: ...80 to 180 NanoTraking Output Voltage 0 to 10 V Circle Scanning Frequency 7 5 to 87 5Hz Circle Position Range 1 to 99 Max Piezo Extension Circle Dia Adjustment Modes automatic and manual Other Input Output Feedback Signal In 0 10V SMA Dual Piezo Position Demand Outputs 0 10V SMA USB Port USB Comms Input Power Requirements Voltage 15V 200mA 15V 100mA 5V 400mA General Housing Dimensions W x D x H 60 ...
Page 55: ...y Power Supply Unit TPS002 K Cube Controller Hub Power Supply KCH301 KCH601 SMA Male to SMA Male Cable 6 CA2906 SMA Male to SMA Male Cable 12 CA2912 SMA Male to SMA Male Cable 18 CA2918 SMA Male to SMA Male Cable 24 CA2924 SMA to BNC Converter Cable 6 CA2806 SMA to BNC Converter Cable 12 CA2812 SMA Female to BNC Male Converter T4289 SMA Male to BNC Female Converter T4290 ...
Page 56: ...Fig D 1 Alignment of optical fibers In Fig D 1 one of the fibers is fixed the other is mounted on a piezo actuated stage that moves the fiber in the horizontal and vertical axes The NanoTrak must adjust the position of the moving fiber until the power transmitted between the two is maximized Fig D 2 shows a block diagram of the NanoTrak control loop In many applications a waveguide or si milar dev...
Page 57: ...itude of the mechanical oscillation modulating signal Fig D 3 AC component of optical power The received power signal contains a frequency component at the scan ning frequency and the phase of this relative to the circle scan voltages gives information on which direction to move When the circle is centred in th e ideal position the power signal contains no modulation at the scanning frequency Howe...
Page 58: ...l for Y phase shifted by 90 with re spect to X see F ig D 4 detail B which produces a circular oscillation The detected signal is compared with both the horizontal and vertical phases of the modulating signal which results in both horizontal and vertical error signals As mentioned previously the polarity of the error signals corresponds to the relative position of the two fibers and consequently t...
Page 59: ...f the control voltage is reversed and movement of the circle becomes erratic The ideal circle size is de pendant upon the shape and dimensions of the optical curve associated with a particular application but should be between 1 10 and 1 20 FWHM full width half maximum Under normal operation the circle size should be reduced in proportion to the coupled signal from a maximum of 3 µmto a value of l...
Page 60: ...control loop it may be necessary to perform application specific adjustments to optimize the speed of response and stability D 2 3 Phase Offset Theoretically if the NanoTrak were to readthe power and respond by moving the fiber instantaneously the power signal read in would be in p hase with the modulating signal In reality the various electronic and electromechanical components e g power meters p...
Page 61: ... if not installed and used in accordance with the instruction manual may cause harmful interference to radio communications Operation of this equipment in a residential area is likely to cause harmful interference in which case the user will be required to correct the interference at his own expense Changes or modifications not expressly approved by the company could void the user s authority to o...
Page 62: ...rlabs or your nearest dealer for further information E 2 2 Waste treatment on your own responsibility If you do not return an end of life unit to the company you must hand it to acompany specialized in waste recovery Do not dispose of the unit in a litter bin or at a public waste disposal site E 2 3 Ecological background It is well known that WEEE pollutes the environment by rel easing toxic produ...
Page 63: ...01 IR T Cube auto alignment controller complies with the following Harmonized European Standards BS EN 61326 1 1998 BS EN 61000 3 2 2000 BS EN 61000 3 3 1995 EN 61010 1 2001 And is in conformity with 93 68 EEC CE Marking Directive 1996 89 336 EEC EMC Directive 1996 73 23 EEC Low Voltage Directive 1997 Signed in Ely place On the 8 day of November 2011 day month year Name Keith Dhese Position Genera...
Page 64: ...Appendix E 64 HA0165T Rev 4K Sept 2017 ...
Page 65: ...1 Japan Tel 81 3 6915 7701 Fax 81 3 6915 7716 www thorlabs co jp Email sales thorlabs jp UK and Ireland Thorlabs Ltd 1 Saint Thomas Place Ely Cambridgeshire CB7 4EX Great Britain Tel 44 0 1353 654440 Fax 44 0 1353 654444 www thorlabs de email sales uk thorlabs com Support techsupport uk thorlabs com Scandinavia Thorlabs Sweden AB Bergfotsgatan 7 431 35 Mölndal Sweden Tel 46 31 733 30 00 Fax 46 31 ...
Page 66: ... Ltd Saint Thomas Place Ely Cambridgeshire CB7 4EX UK Tel 44 0 1353 654440 Fax 44 0 1353 654444 www thorlabs com Thorlabs Inc 56 Sparta Ave Newton NJ07860 USA Tel 1 973 579 7227 Fax 1 973 300 3600 www thorlabs com ...