background image

Page 6

CL-B101D40RPM(d0097) manual

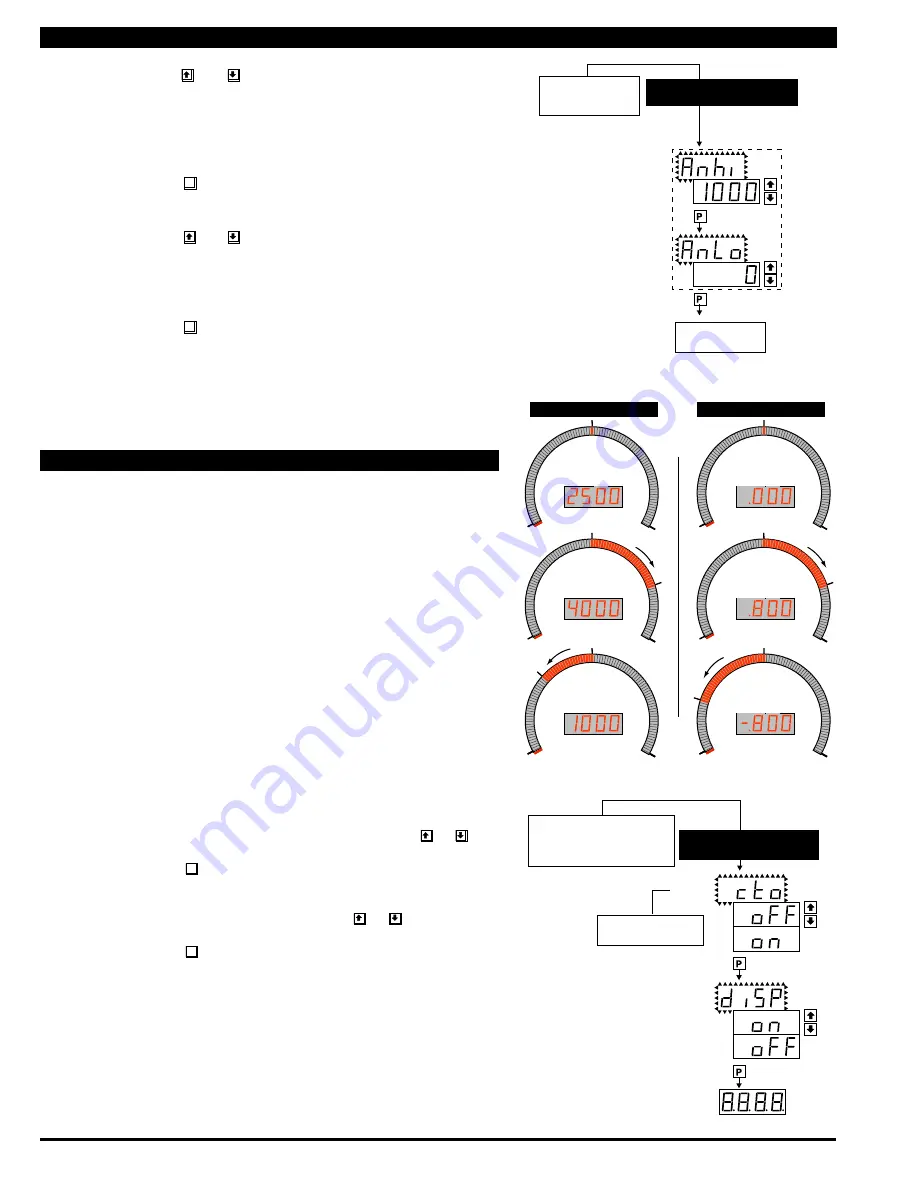
STEP C  Selecting the [Anhi] Digital Value for Analog High Output


1)  Using the   and    buttons, adjust the display to the desired 

digital value at which the [chi] Calibrated Analog High output will 

occur.  For digital readings outside the digital span selected, the 

analog output will linearly rise above the value set for chi, up to the 

maximum analog output capability.  However, the analog output will 

not go lower than the calibrated value set for cLo (see below).


2)  Press the 

P

 button. Display toggles between [AnLo] and 

previous [AnLo] setting.

STEP D  Selecting the [AnLo] Digital Value for Analog Low Output


1)  Using the   and   buttons, adjust the display to the desired  

digital value at which the [cLo] Calibrated Analog Low output will 

occur.  For Digital readings outside the Digital Span selected, the 

analog output will not go lower than the calibrated value set for 

cLo.


2)  Press the 

P

 button. The display toggles between [cto] and 

[oFF].

Note:

 Any two digital span points from –1999 to 9999 can be selected. The digital 

values for [Anhi] analog high and [AnLo] analog low can be reversed to provide a 20 to 

4mA output. The digital span selected can be as small as two counts, when using the 

analog output to function as a Control or Alarm Driver.  Small digital spans will cause 

the high resolution 16 bit D to A to increment digitally in stair case steps.

Digital Span Selection for Analog Range Output

Digital Span Selection for Analog Range Output

Bargraph Center Point Display Mode Selection

STEP E  Bargraph Center Point Mode Selection (See example above)


1)  To select bargraph center point mode, press the   or    

  button. Display changes from [oFF] to [on].


2)  Press the 

P

 button. Display toggles between [diSP] and  


     [on] or [oFF].

STEP F  Digital Display ON/OFF Selection


1)  To set the display to [oFF], press the    or   button. 


     Display toggles between [diSP] and [oFF].


2)  Press the 

P

 button. The display exits the calibration mode  

  and returns to the operational display. Only the bargraph  

  display is on and the digital display is off.

If the digital display is selected to be off, pressing any button to 

make programming changes or to view setpoints activates the digital display. 

When the procedure is complete, the digital display will then automatically 

switch off.

The Display/Bargraph settings are now complete. 

Operational Display

STEP E

STEP F

See Example of Bargraph 

Center Point Display Mode 

Selection Above

From Digital Span Selection

for Analog Range Output Above

or Direct From Digital Span Selection 

for Bargraph Display Page 5

if Analog Output Option is Not Present

BARGRAPH CENTER POINT

DISPLAY MODE SELECTION

STEP C

STEP D

This branch will only

appear if the analog 

output option is installed

To Bargraph Center

Point Display Mode

Selection Below

From Digital Span 

Selection for Bargraph

Display

See Page 5

DIGITAL SPAN SELECTION

FOR ANALOG RANGE OUTPUT

Example of Using the Center Point Bargraph Display Mode

with a Unipolar Input

If the meter's full scale range is set to 5000 counts, the midpoint would 

be 2500 counts. If a signal of 2500 counts is applied only one segment at 

the 2500 count mark will light up. If a signal of 4000 counts is applied the 

segments between the center segment (2500 counts) and the 4000 count 

mark light up.

If a signal of 1000 counts is applied, the segments between the center seg-

ment (2500 counts) and the 1000 count mark will light up.

Example of Using the Center Point Bargraph Display Mode

with Bipolar Signal Inputs

The 

meter

 may also be calibrated to display symmetrical bipolar signals such 

as ± 1 V or ± 10 V. When the center point display mode is selected, it will 

then function as a center zero meter.  When positive signals are applied, the 

bar will go up from the center point, and when negative signals are applied, 

the bar will go down from the center point.

-1V

+1V

0V

-1V

+1V

0.800

-0.800

0V

-1V

+1V

0V

Center Point

Single Bar Lit

Center Point

As signal

increases

Digital display

Digital display

Center Point

As signal

decreases

Digital display

0

5000

5000

2500

2500

4000

0

5000

2500

1000

0

Center Point

Single Bar Lit

Center Point

As signal

increases

Digital display

Digital display

Center Point

As signal

decreases

Digital display

Unipolar Signal Input

Bipolar Signal Input

Summary of Contents for CL-B101D40RPM

Page 1: ...Conventions 2 Input Specs Depends on Input signal conditioner A D Converter 14 bit single slope Accuracy 0 05 of reading 2 counts Temp Coeff 100 ppm C Typical Warm up time 2 minutes Conversion Rate 10 conversions per second Typical Digital Display 4 digit 0 56 LED red std green optn Range 0 to 9999 counts Bargraph Display 101 segment 235º circular bar red std green optn or tricolor optn Polarity A...

Page 2: ...xplain software programming procedures logic diagrams are used to visually assist in following the programming steps The following symbols are used throughout the logic diagrams to represent the buttons and indicators on the meter Programming Conventions X XXX XX XX XXX X XXXX XXXX Front Panel Buttons Program Button The P button is used to move from one program step to the next When pressed at the...

Page 3: ...INT VIEW MODE Bargraph Center Point Display Selection cto This branch will only appear if the analog output option is installed Back to Operational Display Digital Display ON OFF Selection diSP Sub menu MODE Calibration Mode Calibration Input Calibration Output Calibrate Analog Output Low cLo Calibrate Analog Output High chi Select the Digital Reading at which the Analog Output Hi chi will occur S...

Page 4: ...lution PPR 1 Using the and buttons enter the number of pulese per revolution Any number between 1 and 9999 may be enterd 2 Press the P button Display toggles between rg and the previous range setting STEP D Select the Range 1 Using the and buttons selete the required range There are three ranges with resolutions of 0 1 max 999 9 RPM 1 max 9999 RPM and 10 RPM max 99 99 x 10000 RPM 2 Press the P but...

Page 5: ...p for Input Signals up to 3999 counts Bargraph lights up for Input Signals above 4000 counts Bar High Bar Low Bar High Bar Low 0 25 75 100 50 0 25 75 100 50 No bargraph display Digital display No bargraph display Digital display An example of setting the digital span of the bargraph display to be different than the digital display range The bargraph can be set to display full scale 0 101 bars any ...

Page 6: ... is off If the digital display is selected to be off pressing any button to make programming changes or to view setpoints activates the digital display When the procedure is complete the digital display will then automatically switch off The Display Bargraph settings are now complete Operational Display STEP E STEP F See Example of Bargraph Center Point Display Mode Selection Above From Digital Sp...

Page 7: ...any value from 0 3 mA to 18 mA mA output selected or from 0 6 V to 8 V volt output selected However the output of cLo must always be less than the value selected for chi If a reversed analog output is desired the values selected to establish the Digital Span can be reversed see top of page 6 For digital readings outside the Digital Span selected the analog output will not go any lower than the cal...

Page 8: ...to the desired hysteresis hYSt value 2 Press the P button Display toggles between SP2 and the previous SP2 setting STEP F Set Setpoint 2 SP2 1 Using the and buttons adjust the display to the desired SP2 value 2 Press the P button Display toggles between hySt and the previous hySt setting STEP G Set the Hysteresis hYSt Setting for Setpoint 2 1 Using the and buttons adjust the display to the desired...

Page 9: ...Bargraph Color when the bar is ABOVE SP2 Setpoint 1 Using the and buttons select the desired bargraph color grn oran or red 2 Press the P button Display toggles between CSP3 and the previous color setting STEP T Select Bargraph Color when the bar is ABOVE SP3 Setpoint 1 Using the and buttons select the desired bargraph color grn oran or red 2 Press the P button Display toggles between CSP4 and the...

Page 10: ...rminal plugs and do not insert remove or handle screw terminal plugs with live wires connected 17 16 14 15 8 9 10 11 See Leopard Family Input Signal Conditioning Modules 1 2 3 4 5 6 21 20 19 Relay Outputs Reserved for RS 485 LOCK COMMON No Function DIM ANALOG OUTPUT AC Neutral DC AC Line DC ANALOG OUTPUT 29 28 27 26 25 24 23 22 Standard plug in screw terminal connectors provided by Texmate Connect...

Page 11: ...SP4 SP2 Relay Modules with 2 Non Isolated 4A Form A Relays and 2 Non Isolated 9A Form C Relays 29 28 27 25 26 24 23 22 DL Series Options Order Code OR51 OR52 OR53 OR54 210mA 210mA 210mA 210mA 210mA 210mA 210mA 210mA 210mA 210mA SP4 SP3 SP2 SP1 SP4 SP3 SP2 SP1 Relay Modules with 4 Independent 300V 210mA DC only 29 28 27 25 26 24 23 22 DL Series Options Order Code OR31 OR32 OR33 OR34 5A 5A 5A 5A 5A ...

Page 12: ...s for input output leads is recommended with shield connection to earth ground near the meter preferred 4 A circuit breaker or disconnect switch is required to disconnect power to the meter The breaker switch should be in close proximity to the meter and marked as the disconnecting device for the meter or meter circuit The circuit breaker or wall switch must be rated for the applied voltage e g 12...

Page 13: ...en LED Bargraph w 4 Digit Red DPM Horizontal 20 HRG Red LED Bargraph w 4 Digit Green DPM Horizontal 15 HTG Tri Color Bargraph w 4 Digit Green DPM Horizontal 60 HTR Tri Color Bargraph w 4 Digit Red DPM Horizontal 50 DSGG Dual Scale Green LED Vertical Bargraph w 4 Digit Green DPM 30 DSGR Dual Scale Green LED Vertical Bargraph w 4 Digit Red DPM 20 DSRG Dual Scale Red LED Vertical Bargraph w 4 Digit G...

Reviews: