


Hardware
These tabs allow you to see exactly what is happening in your application, and find power black holes. An
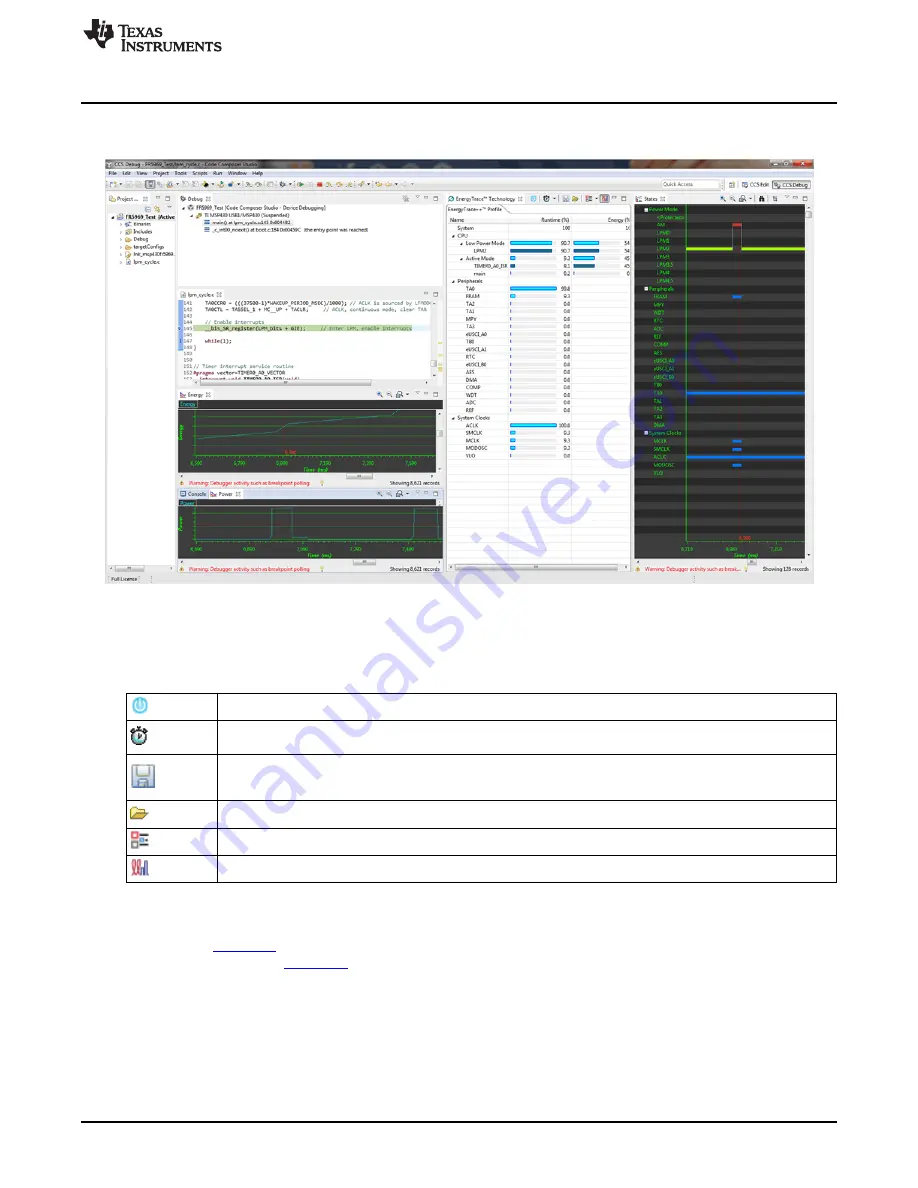
example application with the Ener+ windows is shown in
.
Figure 9. Debug Session With Ener+ Windows
After the EnergyTrace window is active, it can be controlled with the buttons in
.
Table 2. EnergyTrace™ Technology Control Bar Icons
Enable or disable EnergyTrace Technology. When disabled, icon turns gray.
Set capture period: 5 sec, 10 sec, 30 sec, 1 min, or 5 min. Data collection stops after time has elapsed. However,
the program continues to execute until the Pause button in the debug control window is clicked.
Save profile to project directory. When saving an Ener+ profile, the default filename will start with
"MSP430_D" followed by a timestamp. When saving an EnergyTrace profile, the default filename will start with
"MSP430" followed by a timestamp.
Load previously saved profile for comparison.
Restore graphs or open Preferences window.
Switch between
Ener+
mode and
EnergyTrace
mode
An example application using the MSP-EXP430FR5969 with Ener+ Technology is provided in
the application note:
MSP430 Advanced Power Optimizations: ULP Advisor SW and EnergyTrace
Technology
(
). For more details on EnergyTrace, refer to the
Code Composer Studio v6.0 for
MSP430 User's Guide
(
).
13
SLAU535B – February 2014 – Revised July 2015
MSP430FR5969 LaunchPad™ Development Kit (MSP
‑
EXP430FR5969)
Copyright © 2014–2015, Texas Instruments Incorporated


