CTD-ES and CTD-ER Technical Manual
95F-6001-00 (February 2017)
page 35
EAR-Controlled Technology Subject to Restrictions Contained on the Cover Page.
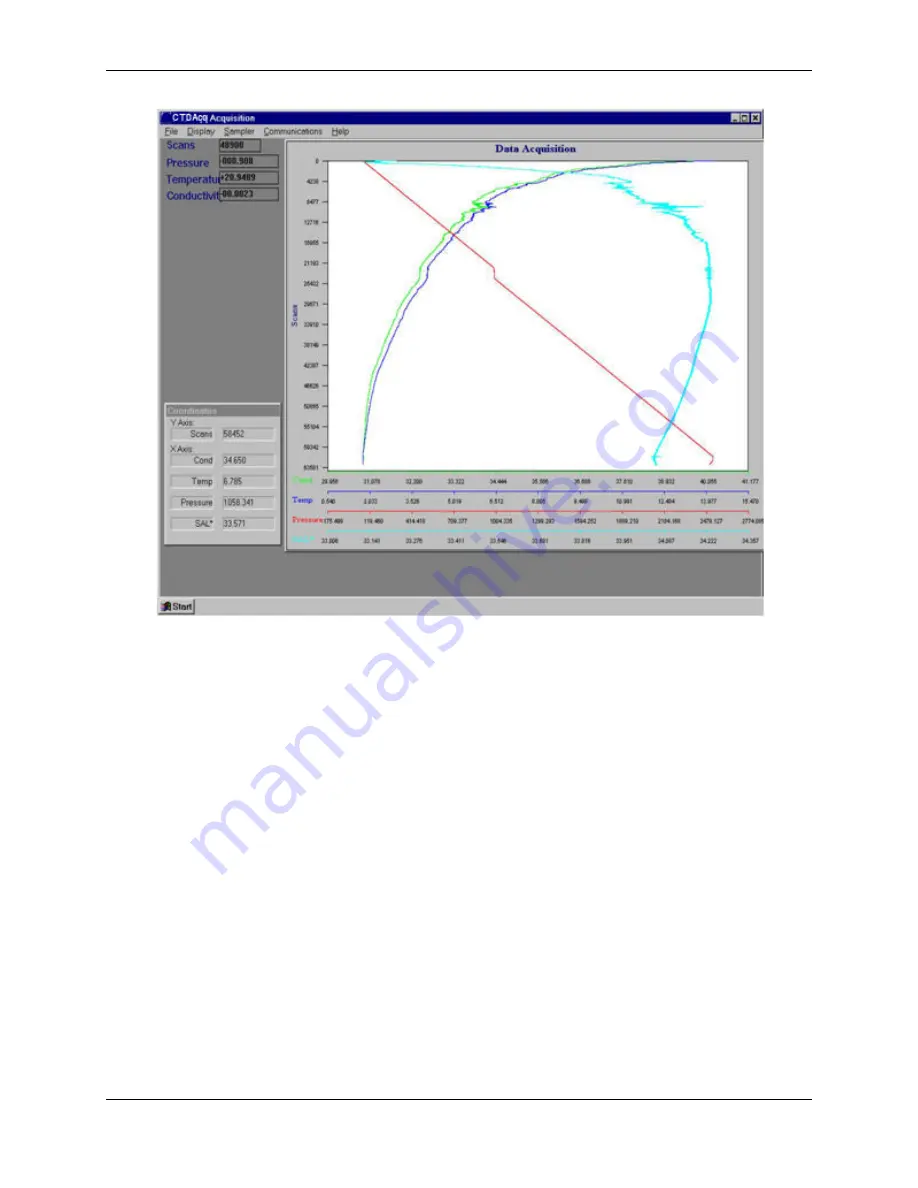
Figure 17.
The Cast Graphics Display with Real-Time Plots of Parameter Data
Zooming in and Out of the Cast Graph
To zoom in on the cast graph, click and hold the left mouse button while drawing a box around
the area you want to zoom in on, and then release the mouse button.
To zoom out to the full view of the graph, choose Display
➤
Graph Zoom All.
Listing the Data with the Cast Graph
Along with displaying plots of the selected parameter data, you can list the data by choosing
Display
➤
Listing.
The data are listed in separate columns in a separate window under the graph. Vertical and hor-
izontal scroll bars are provided for viewing hidden scans and columns. To view scans that are
not shown, click the up or down arrow in the vertical scroll bar to scroll through the scans one
scan at a time. Or drag the scroll box up or down to quickly scroll through the scans. To view
columns that are not shown, drag the scroll box in the horizontal scroll bar to the right. This
scroll box is available only if one or more columns are hidden.
To stop listing the data choose Display
➤
Listing again.


