


©Copyright Task Force Tips, Inc. 1999 - 2011
LIM-030 April 29, 2011 Rev13
12
3.4 DETERMINING FLOW WITH PRE-PIPED MONITORS
The simplest procedure to determine fl ow with automatic nozzles is with a fl ow meter. If a fl ow meter is unavailable, then the
fl ow may be estimated using pressure loss data between the nozzle and an in-line pressure gauge at the pump or considerably
upstream from the nozzle. Data is taken with a smooth bore nozzle and handheld pitot gauge. Note: Equations assume no
substantial change in elevation between in-line pressure gauge and nozzle.
Step1: Determine fl ow of smooth bore nozzle.
Flow water with a smooth bore nozzle and record the nozzle’s size, pitot pressure and in-line pressure gauge reading. The smooth
bore nozzle’s fl ow is calculated from the Freeman formula:
Where:
F = 29.71 for English units (GPM, INCHES, PSI)
F = .667 for metric units (LPM, MM, BAR) Note: 1 BAR=100 KPA
Q
smooth
fl ow in GPM (or LPM)
D
exit diameter in INCHES (or MM)
P
pitot
pitot pressure in PSI (or BAR)
Q
= F x D P
smooth
pitot
2
Step 2: Find pressure loss constant.
Using the results from step 1, use the following equation to calculate the pressure loss constant between the in-line pressure gauge
and the nozzle:
Where:
C piping pressure loss constant in GPM2/PSI (or LPM2/BAR)
P
inline
in-line pressure gauge reading in PSI (or BAR)
Q
2
smooth
P
- P
in-line
pitot
C =
Step 3: Calculate fl ow with automatic nozzle.
Using the pressure loss constant from step 2 and the following equation, the fl ow with an automatic nozzle can be calculated for
your particular installation.
Where:
Q
auto
automatic nozzle fl ow in GPM (or LPM)
P
auto
nominal nozzle operating pressure in PSI (or BAR)
Q = (P
- P )C
auto
in-line
auto
Mount a graph or table of the results adjacent to the in-line pressure gauge. Deliver any desired fl ow by adjustment of pump
pressure.
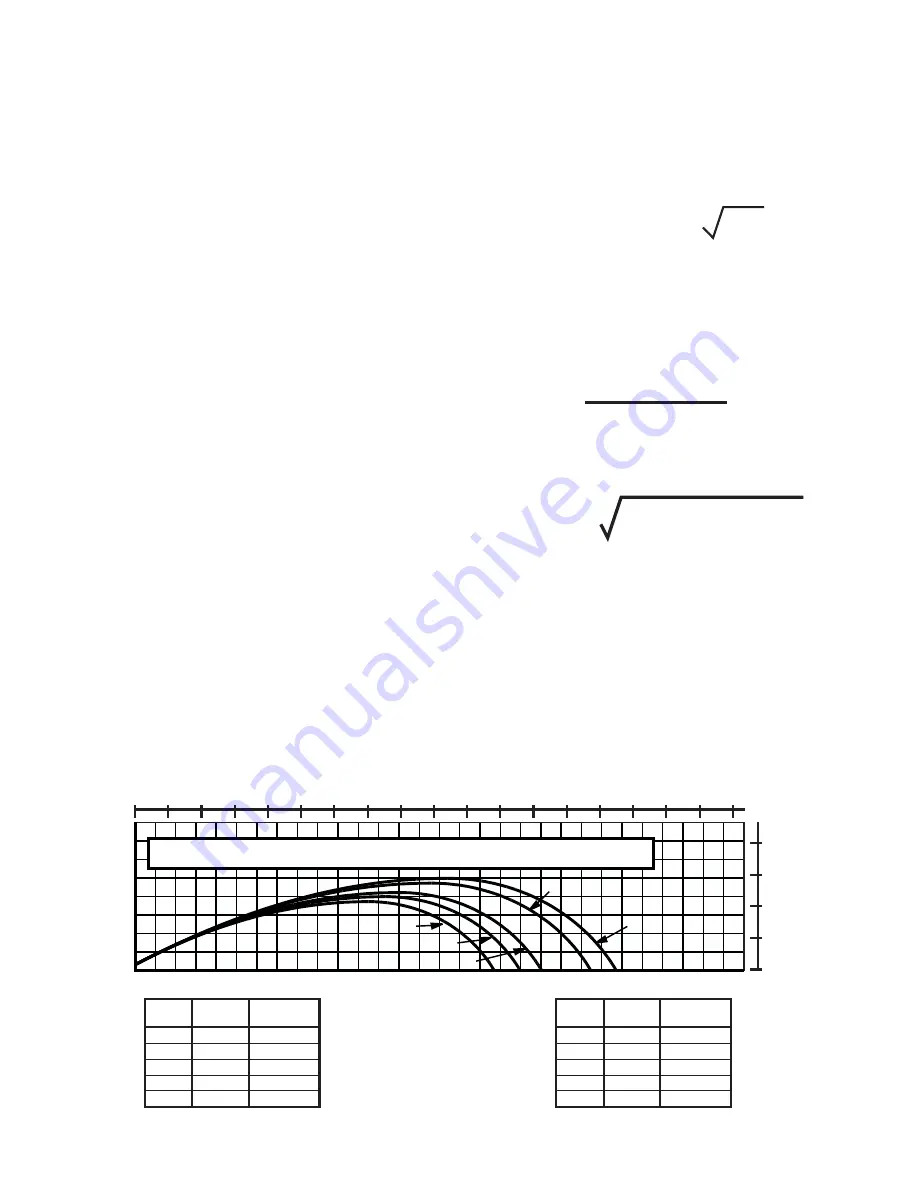
3.5 STREAM TRAJECTORY DATA
Figures 4A - 4E give the stream trajectory for the Masterstream Series nozzles at various fl ows.
Notes on trajectory graphs:
• Graphs show approximate effective stream trajectory at 30 degrees elevation in no wind conditions. Distance to last water
drops approximately 10% farther.
• To estimate trajectories at elevations other than 30 degrees, refer to document LTT-135, available at www.tft.com.
• Trajectories shown are for water. The addition of foam is expected to decrease the reach by 10%.
• Tail or head winds of 20 MPH (30 KPH) may increase or decrease the range approximately 30%.
• Stream trajectory of Masterstream 4000 based on “The Trajectories of Large Fire Fighting Jets” by A.P. Hatton and
M.J.
Osborne, Reference: “The International Journal of Heat and Fluid Flow”, Vol 1 No 1.
0
0
10
10
20
20
30
40
50
60
70
80
0
0
20
10
40
20
60
30
80
40
100
50
120
60
140
70
160
80
90
180
200
220
240
260
280
300
HORIZONTAL DISTANCE (FEET)
VERTICAL DIST
ANCE (FEET)
METERS
METERS
A
B
C
D
E
MASTERSTREAM 1000/1250s, 100 PSI (7 BAR, 700 KPA )
CURVE
A
B
C
D
E
GPM
FLOW
300
400
500
800
1000
LBS
REACTION
150
200
260
400
510
CURVE
A
B
C
D
E
LPM
FLOW
1100
1500
1900
3000
3800
KGF
REACTION
70
90
120
180
230
FIG 4A - Masterstream 1000 Stream Trajectory


