TCS-110
T
EMPERATURE
C
ONTROL
S
TAGE
P
RODUCT
M
ANUAL
52-13129-1
S
OLID
S
TATE
C
OOLING
S
YSTEMS
,
167
M
YERS CORNERS
R
OAD
,
W
APPINGERS
F
ALLS
,
NY
12590
14
T
ELEPHONE
:
(845)
296-1300
F
AX
:
(845)
296-1303
WEB
:
V
ERSION
E6
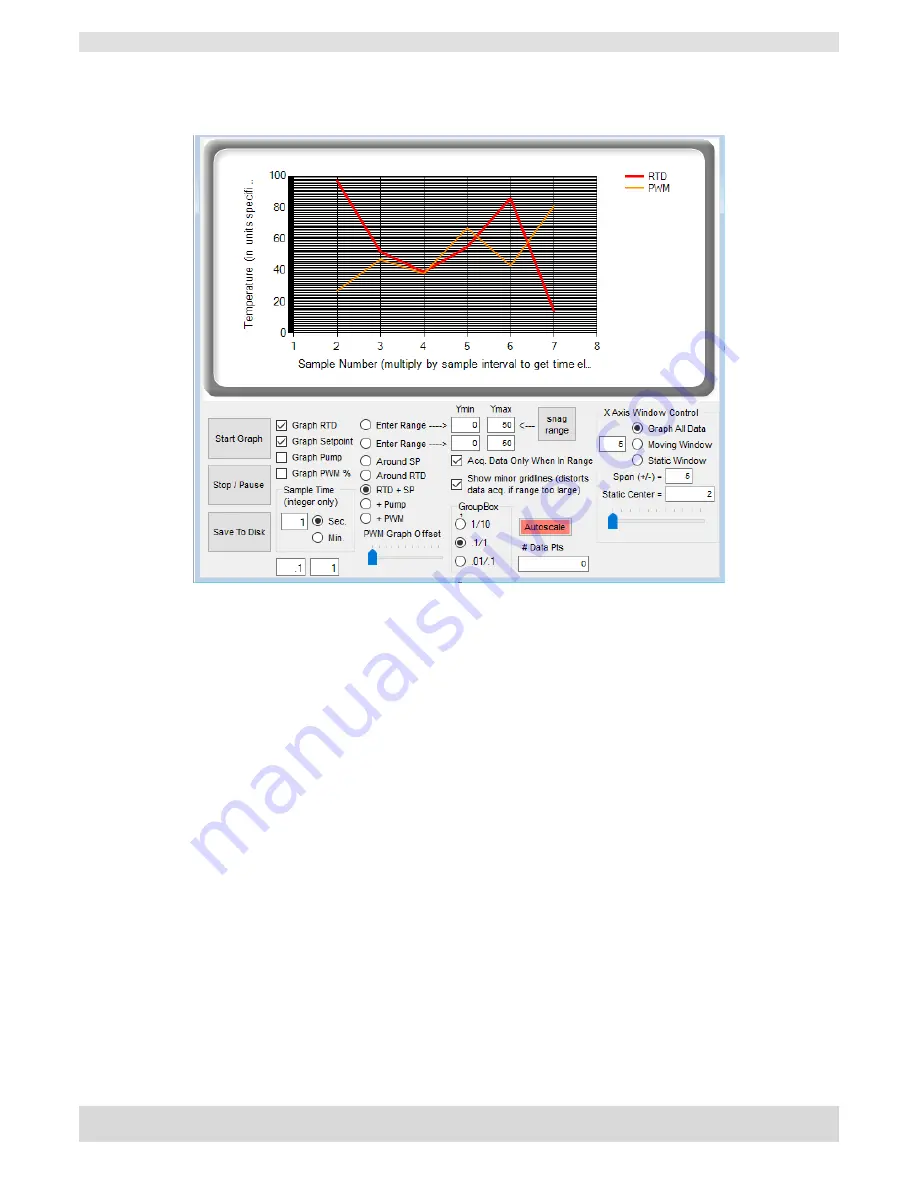
Figure 15: Graph Window
4.4.2 Explanations for Performing Common Tasks with GUI (continued)
•
Graph TCS-110 Performance (continued)
o
Press the
Start Graph
button to start graphing the parameters to the right of the button
that are checked. To change the range of the Y-axis, change the Ymin and Ymax values
next to either of the two
Enter Range
buttons and click the corresponding button to set a
new range.
o
To save the data that is graphed, press the
Stop/Pause
button to pause the graph and then
press the
Save To Disk
button to save a .csv file containing the parameters which were
graphed.
•
Change Maximum % Heating/Cooling
o
Enter a new value in the “%Max Heat” or the “%Max Cool” box in the System Params
component (Figure 11) and click the
P
button next to the box.
•
Display Temperature in Two Decimal Points
o
Click the “2 Dec Pts” checkbox in the System Config component (Figure 12) and press
the
P
button next to the CFG1A box. To change the temperature back to 1 decimal point,
uncheck this box and press the same
P
button.


