


EDR Function
41
A. Data File List and Calendar
On the calendar section, all the dates that have data will be highlighted in blue.
Click on the date you wish to view and all the data from that day will be listed on
the Data File List section.
B. Data File List Control Buttons
[Select All], [Unselect]: Utilise these buttons to select the data files you wish to
view more efficiently.
[Load]: This button should be used to load the selected data.
C.
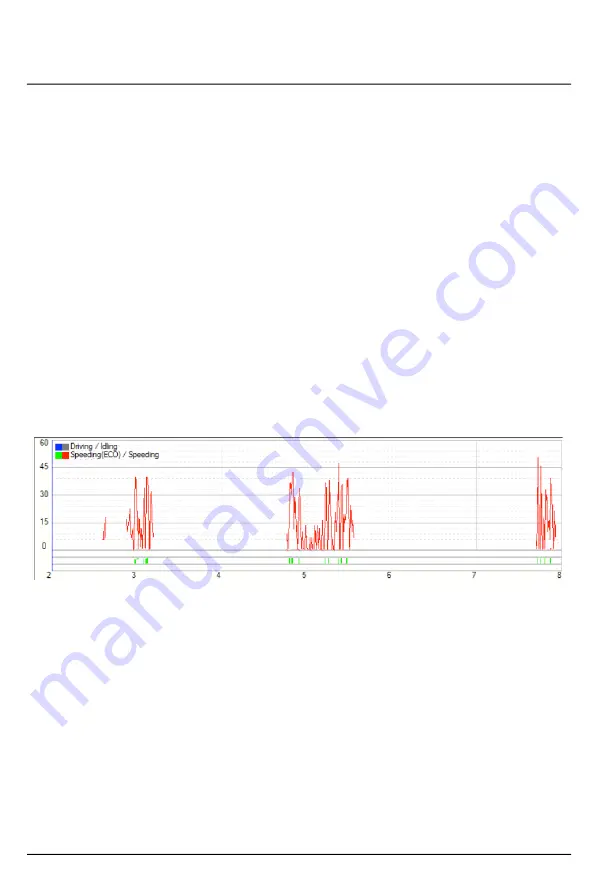
Drive Data Graph
The Drive Data Graph displays, Speed and G-Sensor information for the
file selected by the user.
1) Speed
The axis on the left hand side indicates Speed. The Scale can be configured in
the setup menu.
The Speed is shown as the red line of the graph.
The colour key at the top of the page explains the progress bars on the
bottom of the graph.
Driving / Idling – Blue when driving, grey when Idling
Speeding (ECO) / Speeding – Green when exceeding the eco-speed limit, and
red when exceeding the speed limit.