


Page 21
Enhanced Acquisition
Before entering Enhanced Acquisition, first configure the instrument in the Instrument Set Up section.
Enhanced Acquisition - Spectrum Tab
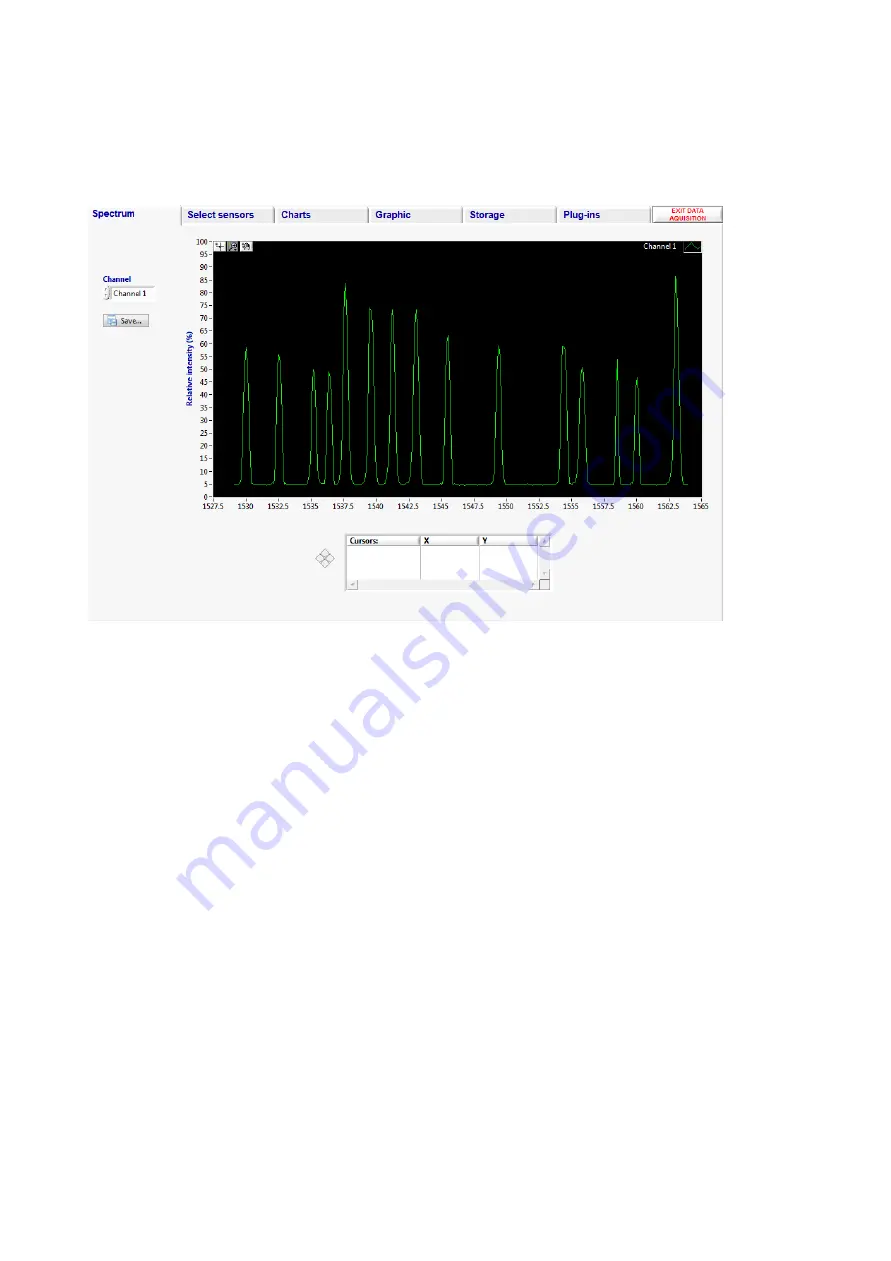
Figure 15 - Enhanced Acquisition - Spectrum Tab
The spectrum tab is intended as a tool to aid setting up of sensors and/or SmartScan parameters. The
sensors on one channel at a time can be viewed with the reflected signal intensity displayed over the
wavelength range. Each peak represents the reflected light from one FBG. The appearance of the FBG
Peaks will be influenced by the Gain scheme selected during Instrument Set Up.
If desired the instantaneous spectrum can be saved to file, press the save button whilst the channel of
interest is being viewed. An image of the spectrum can be exported to the clipboard or a file by right
clicking in the graph area. Note that the data rate for spectral data is much slower than for sensor data.
The graph palette in the top left corner of the graph provides options for navigating around the screen.
The cross icon is the selection tool and is used for selecting and moving graph cursors, the magnifying glass
icon allows the user to zoom in on the graph to examine particular spectral features in more detail and the
hand icon is used to drag a magnified region around the plot.
The plot legend in the top right of the graph can used to change the plot properties, e.g. line style/colour,
point style/colour, etc.
Extra functionality is made available by right clicking in the graph and selecting from the pop-up menu. The
scale legend can be used to gain quick access to the graphs auto-scale options and for changing scale
indicator parameters such as numeric format, precision, etc. The cursor legend is used for creating cursors
on the graph and reading the position of those cursors. Cursors can be created by right clicking inside the
cursor legend and can be dragged with the selection tool (see graph palette section). The cursor can be
configured by right clicking on its name in the cursor list.


