


Page 16
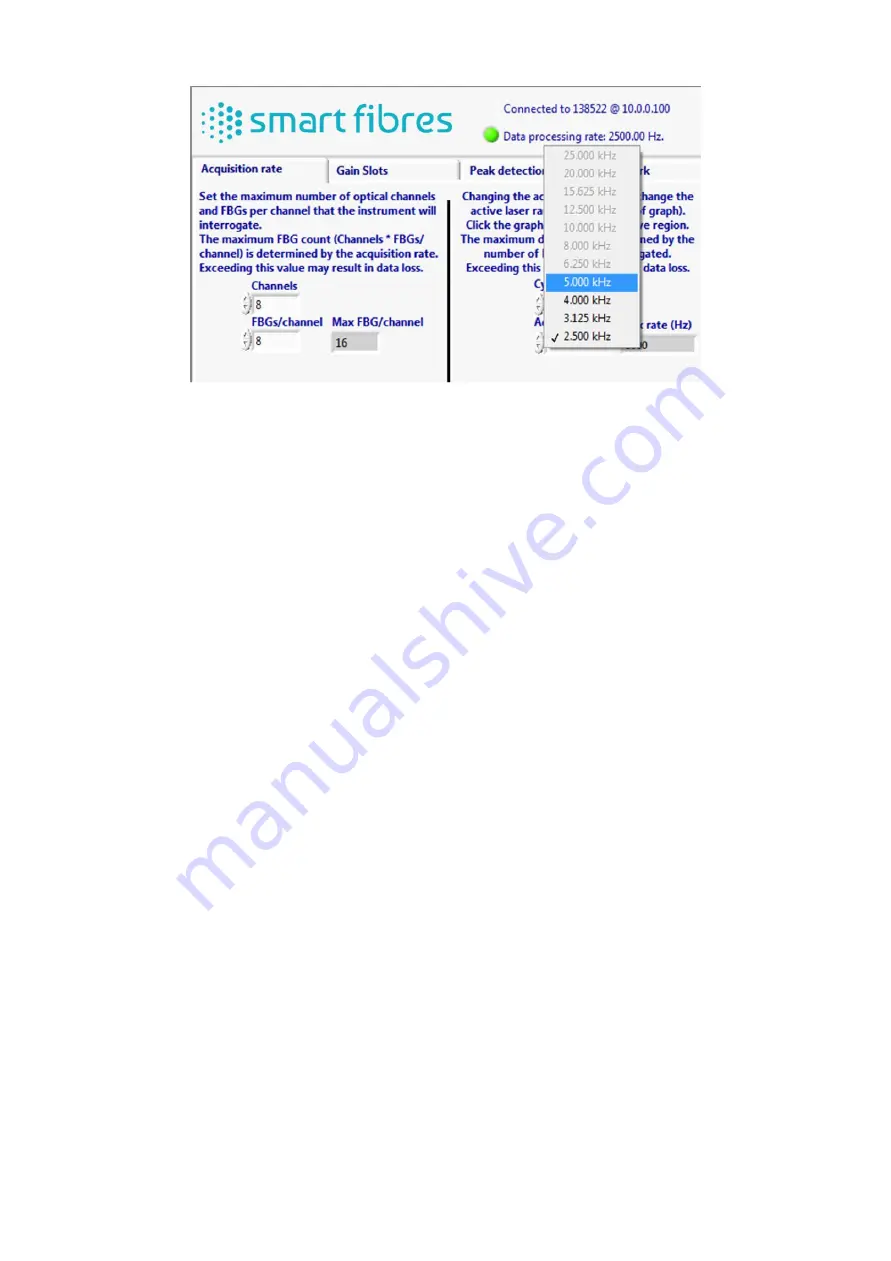
Figure 10- Instrument setup - Acquisition rate selection
The active laser range will be reduced according to the selected acquisition rate. The inactive range will be
greyed out in the graph. Left click on the graph with the mouse to centre the active region in the desired
location. Select the lowest acquisition rate in the list to reset the active region to its full range.
Consideration should be given to the expected wavelength excursions of each FBG peak to ensure that they
will not move outside the laser tuning range.
The rate at which data are transmitted to the host PC can be reduced by sampling the data. Setting the
Data Rate to 1 means that the SmartScan will transmit all available data to the PC and the transmission rate
will be equal to the acquisition rate. Setting the Data Rate to a number N greater than 1 will result in data
from every N
th
scan being transmitted. It may be desirable to slow down the transmission rate because, for
example the data are transmitted over a slow network connection or because the host PC cannot process
the data packets fast enough.
Finally, the user may further reduce the amount of data stored in a log file by applying averaging or
decimating the data. This is applied by the SmartSoft application so will not reduce the Ethernet traffic but
will reduce the data presented by SmartSoft and optionally saved to file. The extent of data reduction is
controlled by the Sample size box. Setting this to a number N will result in every Nth transmitted data point
being presented or stored, either by averaging N points together or by keeping every Nth point and
discarding the rest. Averaging N data points together will also improve the signal to noise ratio by up to a
factor of √
N.
The data processing rate is displayed at the top of the screen when acquisition is in progress. The
acquisition and transmission rates are shown as a tool tip when hovering the mouse over the data
processing rate indicator.


