46
|
P a g e
Archimede Portable Dataloggers User Manual
rev.5 -03.12.2019-
Inclinometer test graphs
When the user performs an inclinometer test, it is necessary to make a distinction between the
reference test (usually the first test performed, which measures are therefore absolute) and the
other tests in which, what matters is usually the difference between the current values and the
values recorded in the reference test (relative measures).
The graphs for these two options are slightly different.
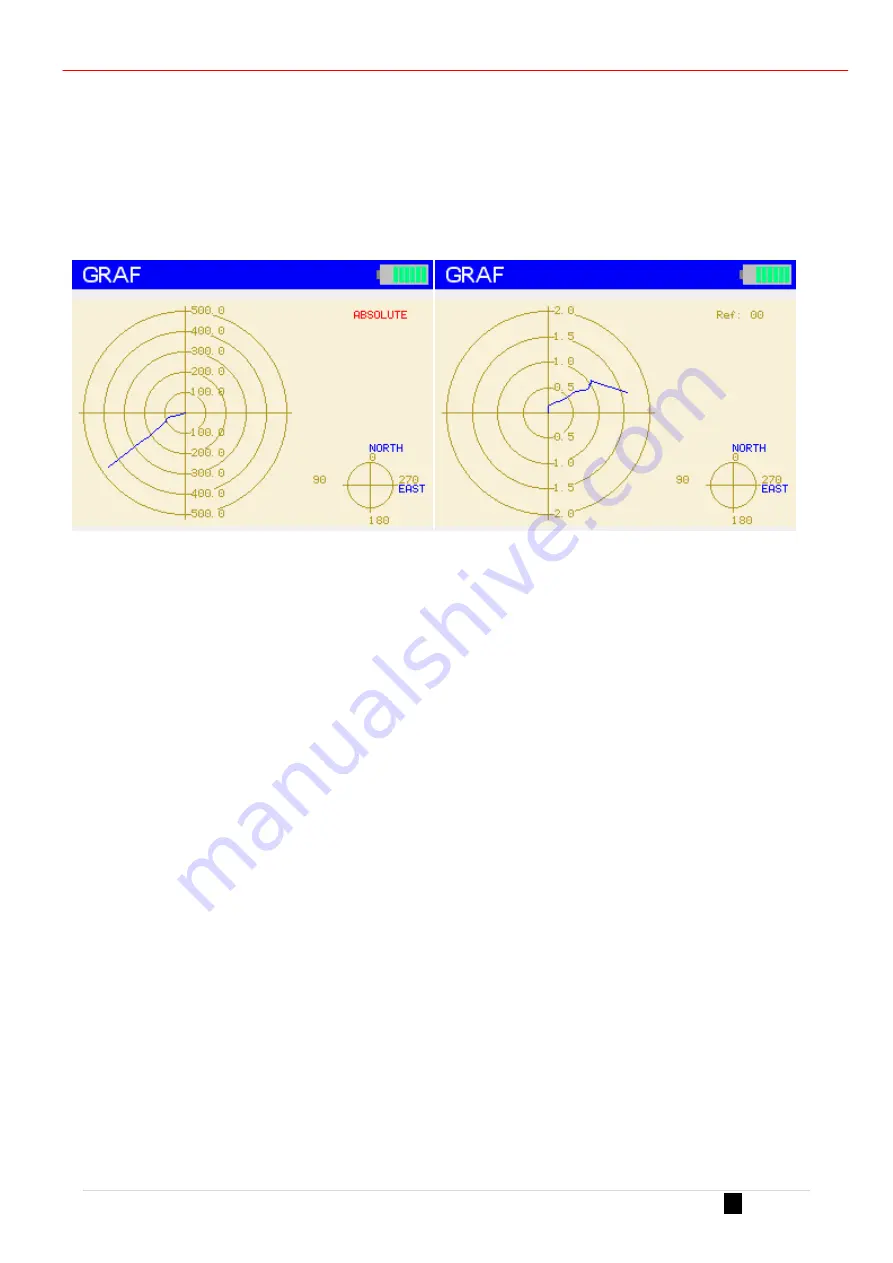
The graph for the reference test on the left is labeled as ABSOLUTE, while the graphs for the other
tests display a label indicating the test being used as reference. The reference test (or the fact that
a test is absolute) is selected when starting the test and cannot be changed later.
In the absolute graph on the left the blue line represents the inclinometer tube as seen from the
top (the center corresponds to the start of the tube).
In the relative graph the offset of the reference test is subtracted before drawing the graph and
the line represents the movement of the tube from the original position as seen from the bottom
(the center corresponds to the end of the tube
Push
ENTER
again to view a different representation of the same data. This time the line
represents the displacement of the tube from the vertical line for the first absolute graph and
from the reference measurement for the second relative graph.
Again, the reference zero is the top of the tube for the first graph and the bottom for the second.


