REMOTE ACCESS HOW TO
07.10.2021
Page 55
5.8.2.3 Create a data display dashboard
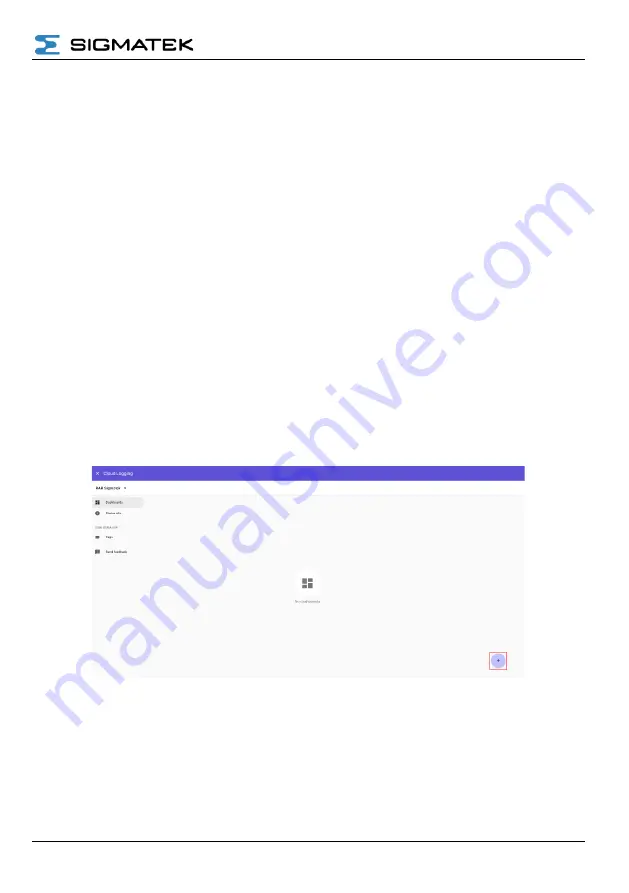
1. From the Cloud Logging menu,
click on “Dashboards”.
2.
Click on the “+” button to create a new dashboard (Figure 5.81). Dashboards may
be imported from file or created from scratch.
3. From the options, select data report (historical) or live monitor (Figure 5.82).
4. Assign a name to the dashboard and select the design theme (Figure 5.83). Click
“Add” to move to the design step.
5. Dashboard widgets can be selected, and tags assigned to each widget in the
Dashboard designer (Figure 5.84).
a. Value widget: a data value display (Figure 5.86).
b. Status widget: an indicator dependent upon one or more conditions (Figure
c.
Gauge widget: an analogue style data value display (Figure 5.88).
d. Graph widget: for trending a data source (Figure 5.89).
6. After configuration is complete, the changes must be pushed to the device from the
device “Config” tab. The dashboard can be viewed from the “Info” tab (Figure 5.85).
Figure 5.81
Create a new dashboard by clicking the “+” button.
Summary of Contents for RAE 100
Page 67: ...REMOTE ACCESS HOW TO 07 10 2021 Page 67 6 1 1 Example 1 RAR wired single CPU solution...
Page 68: ...REMOTE ACCESS HOW TO Page 68 07 10 2021 6 1 2 Example 2 RAR wired dual CPU solution...
Page 69: ...REMOTE ACCESS HOW TO 07 10 2021 Page 69 6 1 3 Example 3 RAR WIFI single CPU solution...
Page 70: ...REMOTE ACCESS HOW TO Page 70 07 10 2021 6 1 4 Example 4 RAR WIFI dual CPU solution...
Page 71: ...REMOTE ACCESS HOW TO 07 10 2021 Page 71 6 1 5 Example 5 RAR cellular single CPU solution...
Page 72: ...REMOTE ACCESS HOW TO Page 72 07 10 2021 6 1 6 Example 6 RAR cellular dual CPU solution...
Page 75: ...REMOTE ACCESS HOW TO 07 10 2021 Page 75 6 2 3 Example 9 RAE100 As Gateway...


