SDS2000X Plus Series Digital Oscilloscope User Manual
213 / 335
WWW.SIGLENT.COM
19.4
Frequency Analysis
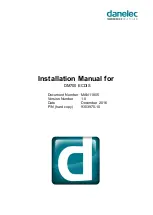
The result of FFT (Fast Fourier Transform) calculations is the frequency
spectrum of the source signal. The horizontal axis of the FFT display is
labeled using frequency (Hz) units instead of time (seconds). In addition,
the vertical axis provides the option of logarithmic scaling
(dBVrms/dBArms or dBm). In this mode, the oscilloscope display is very
similar to a spectrum analyzer.
A.
Time-domain waveform display area
B.
Spectrum (FFT) waveform display area
C.
FFT parameter display area
D.
Dialog box
Parameter Display Area
The FFT parameters are displayed in the upper right of the spectrum
Summary of Contents for SDS2000X Plus Series
Page 1: ...SDS2000X Plus Series Digital Oscilloscope User Manual UM0102XP E01B ...
Page 225: ...SDS2000X Plus Series Digital Oscilloscope User Manual 225 335 WWW SIGLENT COM editor ...
Page 274: ...SDS2000X Plus Series Digital Oscilloscope User Manual 274 335 WWW SIGLENT COM ...
Page 292: ...SDS2000X Plus Series Digital Oscilloscope User Manual 292 335 WWW SIGLENT COM M2 Mode M3 Mode ...
Page 335: ...SDS2000X Plus Series Digital Oscilloscope User Manual 335 335 WWW SIGLENT COM ...