background image


8

1.3 Definitions 
 
Before  explaining  how  to  use  the  FastTracer,  some  aspects  should  be  dealt  with,  such  as  the 
FastTracer  technical  specifications,  the  type  of  measurements  which  can  be  carried  out  and  what 
information can be obtained from these data. 
 
1.3.1 Technical specifications 
 
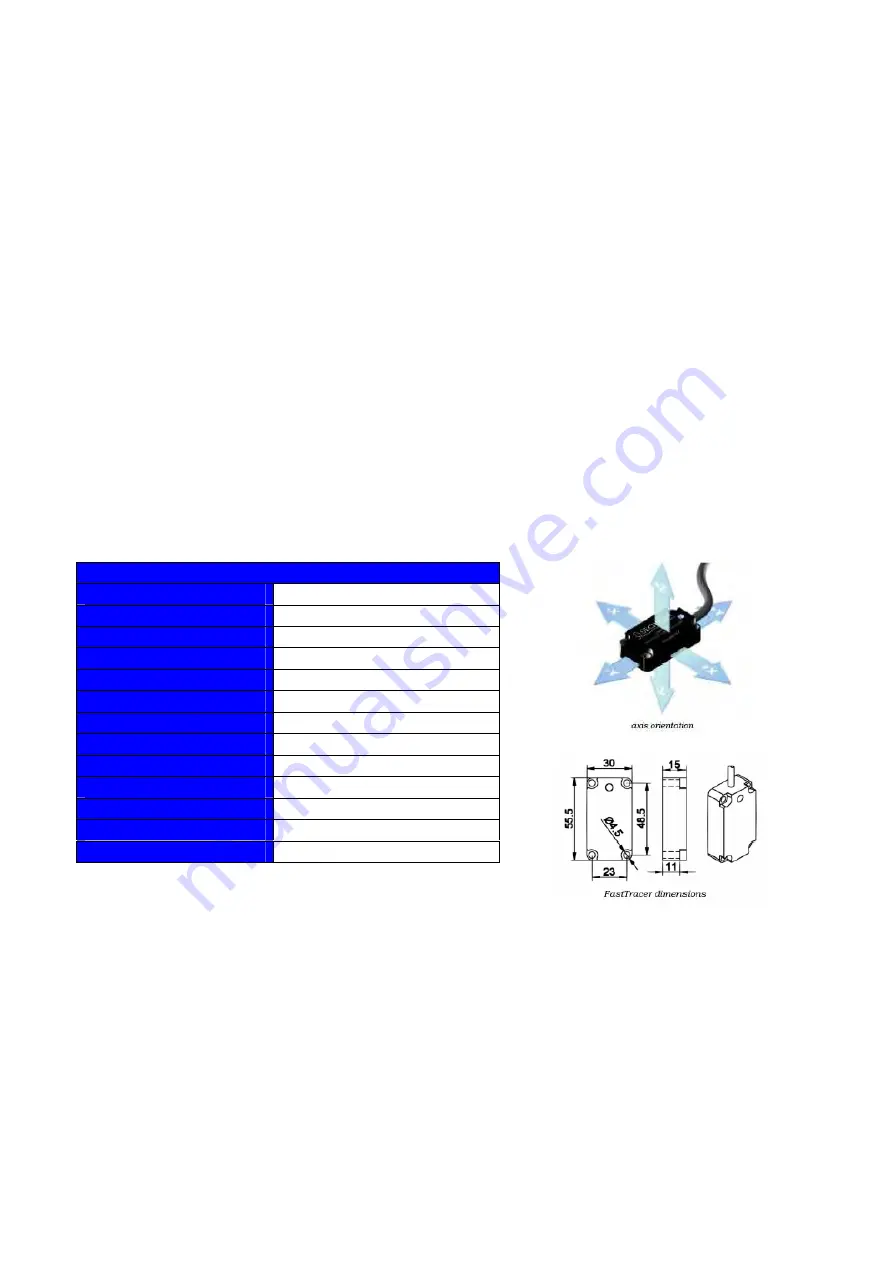
The  FastTracer  solution  consists  of  an  acquisition  device  (also  called  sensor  or  measurement 
device) and a software for data display and processing. The measurement device is fitted inside with 
an innovative MEMS triaxial capacitive accelerometer interfaced with a microprocessor processing 
and  transmitting  the  digital  signal  to  the  PC  through  the  USB  2.0  or  via  WiFi  (opt.).  The  digital 
transmission of measurements ensures the data resistance to electro-magnetic disturbances while the 
MEMS technology provides the sensor with a self-diagnosis capacity thus minimizing the need for 
routine  calibration.  The  software  developed  by  Sequoia  IT  and  provided  with  FastTracer  are 
FTAnalyzer and Esplora 3D. These two types of software and their application for diagnostics and 
measurement  are  fully  described  in  the  pages  below.  The  system  is  equipped  with  a  complete 
solution  which  does  not  require  any  other  software  or  hardware,  offering  an  excellent  acquisition 
device  shock  resistance  up  to  10,000g,  the  possibility  of  updating  the  firmware  via  software, 
reduced costs and IP67 protection level. 


TECHNICAL SPECIFICATIONS 

Maximum acceleration: 

+/- 5 g optional: 2g, 18g 

Frequency band: 

0 – 2500 Hz 

Resolution: 

0.0025 m/s

2


Noise: 

0.075 m/s

2


Dimensions: 

30 x 55 x15 mm 

Weight: 

55 g 

Cable length: 

3 -30 m 

Communication: 

USB 2.0 – Wi Fi (Optional) 

Protection rating: 

IP67 

Shock resistance: 

10,000 g 

Temperature range: 

0° C..+70°C 

Conformity: 

CEI UNI – EN 61000-6-2/4 

Software: 

FastTracer suite Software 


Summary of Contents for FastTracer

Page 1: ...FastTracer PORTABLE VIBRATION ANALYSIS SOLUTION Use and installation manual Vibration monitoring expert solutions...

Page 2: ...Printed in February 2010...

Page 3: ...ensure that any information provided in this manual is without errors inaccuracies and omissions Notwithstanding this all information is provided here as is Sequoia IT cannot guarantee the reliability...

Page 4: ...o not dispose of these products as undifferentiated urban waste but put away for material differentiated recycling Copyright All the contents text graphics and images in this manual are protected by c...

Page 5: ...s area 17 3 4 2 Devices list 18 3 4 3 Menu 19 3 4 4 Global settings 19 3 4 5 Toolbar 20 3 5 New view 22 3 5 1 Time time domain measurement 23 3 5 1 1 Time display options 24 3 5 1 1 1 Time selection o...

Page 6: ...lora 3D 5 1 Philosophy of use 44 Model instance 45 Model DB 45 5 2 Start 45 5 2 1 Import model DB 46 5 3 Test model instance model machine selection 46 5 3 1 Create model instance instance creation 47...

Page 7: ...se this flexible system to its full potential 1 2 1 Prerequisites The information in this manual is intended for readers with a basic IT knowledge and good knowledge of vibration analysis Therefore th...

Page 8: ...echnology provides the sensor with a self diagnosis capacity thus minimizing the need for routine calibration The software developed by Sequoia IT and provided with FastTracer are FTAnalyzer and Esplo...

Page 9: ...lled on your computer FTAnalyzer Esplora 3D Through mathematical calculations the software will provide all direct and indirect measurements needed for diagnostics or experimental research 1 3 3 Diagn...

Page 10: ...lained in chapter 5 this model can be used by less skilled users who following the instructions provided by the Esplora 3D software will be led in the fault diagnosis function The use of the FastTrace...

Page 11: ...uires the following hardware Minimum Standard Suggested Processor X86 500 MHz X86 900 MHz X86 1 6 MHz RAM 128 MB 512 MB 1 GB Hard Disk available space 20 MB 1 GB 5 GB Video SVGA SVGA SVGA Ports USB 2...

Page 12: ...not to connect the measurement device until the software installation procedure is complete Proceed as follows for installation After installing Esplora 3D at least one of the FastTracer measurement d...

Page 13: ...screws 2 5 Frequently Asked Questions FAQ Q The software does not see the connected device A Open the Device List and click the Refresh Device List key Q The software does not start correctly A Try to...

Page 14: ...sponding to the full scale of your FastTracer 18g 5g 2g and frequency between 0 Hz and 2500 Hz For the best use of FastTracer devices carefully read the pages below as they provide a description of FT...

Page 15: ...cy domain or both In time domain you can view the acceleration components in the measurement point or indirect measures resulting from processing such as Rms values or xy xz yz and xyz modules Time Do...

Page 16: ...TAnalyzer find the Windows start button and click as follows Start Programs SequoiaIT FTAnalyzer FTAnalyzer 1 2 z t Should the program not start or any error messages be displayed follow the suggestio...

Page 17: ...ransform FFT of acquired measures In these views the FTAnalyzer applies the Fast Fourier Transform to the acquisition signal and displays its frequency spectrum FTAnalyzer different Graphics areas dis...

Page 18: ...en Off line but actually work as connected devices In the Devices List all the FastTracer connected acquisition devices are displayed with the following acronym FastTracer SQ S xxxxxx while device fil...

Page 19: ...ew Global Settings in this view you can change different FTAnalyzer parameters To exit the program To carry out measurements see paragraph 3 5 To load a file as file device To display the device list...

Page 20: ...set the type of diagram Y axis scale in the frequency domain To set the minimum value of the diagram X axis scale in the frequency domain To set the maximum value of the diagram X axis scale in the fr...

Page 21: ...be enabled Conditions are based on the OR logic To display the device sending data to the viewed graphics area When active the data acquisition is blocked To start turn off the data recording on file...

Page 22: ...e Menu Toolbar as follows View New View After accessing the New View function FTAnalyzer will ask the user to select the measurement domain the value to be acquired and the acquisition device to be us...

Page 23: ...box The terms used in the signal type combo box are explained below Axes to measure and display the acceleration x y z components measured by the acquisition device Axes Modules to measure and display...

Page 24: ...e RMS value will be reckoned by means of Please note that in the RMSi 1 formula the RMS value is prior to the nth measure and Tk is the time constant 4 The value is set in the buffer position 1 5 Calc...

Page 25: ...As shown in the figure you can enable Low Pass and High Pass filters Both are 4th order filters with 80dB decade gradient 3 5 2 Frequency frequency domain measurement To display measures in the freque...

Page 26: ...requency resolution a high number of points shall be used i e a high value of the FFT points parameter However the data buffer used for the spectrum calculation shall include a sampling number twice t...

Page 27: ...of displayed values To select the track to be displayed proceed as follows Settings Track FTAnalyzer Selection of tracks and display parameters frequency You can select the analysed event the colour...

Page 28: ...ation shows an idea of the total vibration effect but doesn t offer an evaluation of the magnitude distribution at the single frequency component Once the bandwidth is defined between MinX Hz and MaxX...

Page 29: ...n click on TRIGGERED in the view type combo box Measurements taken this way will be reported both in the time and frequency domain To select the value to be measured select one of the following terms...

Page 30: ...the file path and name Axis for trigger detection according to OR logic Stop time after trigger event in ms POSITIVE acquisition starts when the signal exceeds the trigger value up the slope NEGATIVE...

Page 31: ...a File Device and load stored measures proceed as follows Click on the New File Device icon Use the combination of Ctrl F Click with the right button on the Device List and select new device from fil...

Page 32: ...ied space FTAnalyzer opening and reproduction of data stored in a File Device The combo box 3 displays a floppy icon showing the virtual device To reproduce or analyze the measure open a new view by c...

Page 33: ...he interval minute length of the measure to be extracted FTAnalyzer extract data from File Device Please note that if a device has been created and a view has been closed by mistake it can be opened a...

Page 34: ...ected part will be exported at a sampling speed of 18113 21 samples s for time domain If the frequency spectrum of one or more events is exported the file points will correspond to the points used to...

Page 35: ...n the diagram and find the starting point so that a vertical bar will be displayed then drag the latter up to the point where data shall be exported Now open the pop up menu with the mouse right butto...

Page 36: ...y domain measures Acceleration spectrum Spectrum XA Spectrum YA Spectrum ZA Velocity spectrum Spectrum XV Spectrum YV Spectrum ZV Displacement spectrum Spectrum XD Spectrum YD Spectrum ZD 3 8 1 Note o...

Page 37: ...37 Microsoft Excel configuration In case of Microsoft Excel protection notice click on the Option key in the protection notice and select Enable content Microsoft Excel configuration protection notice...

Page 38: ...ad To save the view configuration find the Perspective menu and proceed as follows Perspective Save perspective or Ctrl S To restore the previously saved view configuration proceed as follows Perspect...

Page 39: ...ures and the way they can directly or indirectly interact with Sequoia IT software Architecture for use of Sequoia IT software First it is necessary to make a distinction between the vibration expert...

Page 40: ...ments Of course for each test it is advisable to work out a consistent set of measurements to be repeated an appropriate number of times Each test will provide information on the machine state Therefo...

Page 41: ...del to display a mask called Editing Model inside the main view to set the archive fill in the mask with machine description machine family manufacturer reference model and machine images and finally...

Page 42: ...nation To draw the rectangle click on the figure and drag the mouse until reaching the desired size The rectangle will help the operator find the area to be measured In the figure on the left an addit...

Page 43: ...ng fields The Thresholds field defines thresholds in the frequency or time domain When these thresholds are exceeded the program will display messages informing the operator As the aim of these messag...

Page 44: ...D click on Export Database to file Action to be taken by the maintenance operator Message to be communicated to the operator Threshold value Lower end of threshold field in frequency domain Type of th...

Page 45: ...sts and related guidelines with FTEditor while the maintenance operator will perform these tests through the Esplora 3D software for the machine state detection Architecture for use of Sequoia IT soft...

Page 46: ...As a result for the machine identification it is necessary to create a Model Instance by setting at least two of the parameters shown in the table Model DB Model DB is the archive regarding a specific...

Page 47: ...the machine diagnostics procedures while the Browse Model Instance Tests Reports key will browse stored reports Before diagnostics always make sure that the software has loaded the suitable archive Mo...

Page 48: ...the loaded model Back to cancel operation and return to the previous view Test Selected Instance to carry out tests Select the model in the Models section and the created instance in the Instances se...

Page 49: ...sed to display other images if loaded Esplora 3D Operator instructions After identifying the sensor positioning area you can perform tests by clicking Execute All Tests Another view will be displayed...

Page 50: ...aphics area In case of failure the database message will be displayed again with the related suggested action to be taken When the test is concluded the operator can decide to draw up a report and sav...

Page 51: ...consists of three pop up menus offering different actions The table below provides the list of menus and their general description To import a test archive To exit the program To view the device list...

Page 52: ...ation analysis Technical Associates of Charlotte P C 2 Analysis II Concentrated vibration signature analysis and related condition monitoring techniques Technical Associates of Charlotte P C 3 An intr...

Page 53: ...53 Notes...

Page 54: ...54 Sequoia IT s r l via Einaudi 25 10024 Moncalieri TO Italy info sequoia it www sequoia it Vibration monitoring expert solutions...

Reviews: