SeeedStudio SARK-110 User Manual Download Page 16


SARK-110


User’s Manual 

Rev 1.2.19 January 12

th

, 2020 

- 16 - 

© Melchor Varela 

– EA4FRB 2011-2020 


2.8  Using Markers 

The  SARK-110  has  two  markers  that  can  either  be  manually  positioned  by  the  user  or  set  to 

operate in automatic tracking mode. The markers indicate the horizontal and vertical position of 

the point on which they are positioned. The horizontal position of a marker is shown by a dotted 

vertical  line  which  extends  from  the  top  to  the  bottom  of  the  measurement  diagram.  The 

markers information window, in blue background, shows the frequency (or distance in cable test 

mode) and the two values that correspond to the plotted values at each of the markers. 

Use Navigator A to highlight either 

«MARK 1»

 or 

«MARK 2» 

in the main menu. 

Press  the  Select 

[

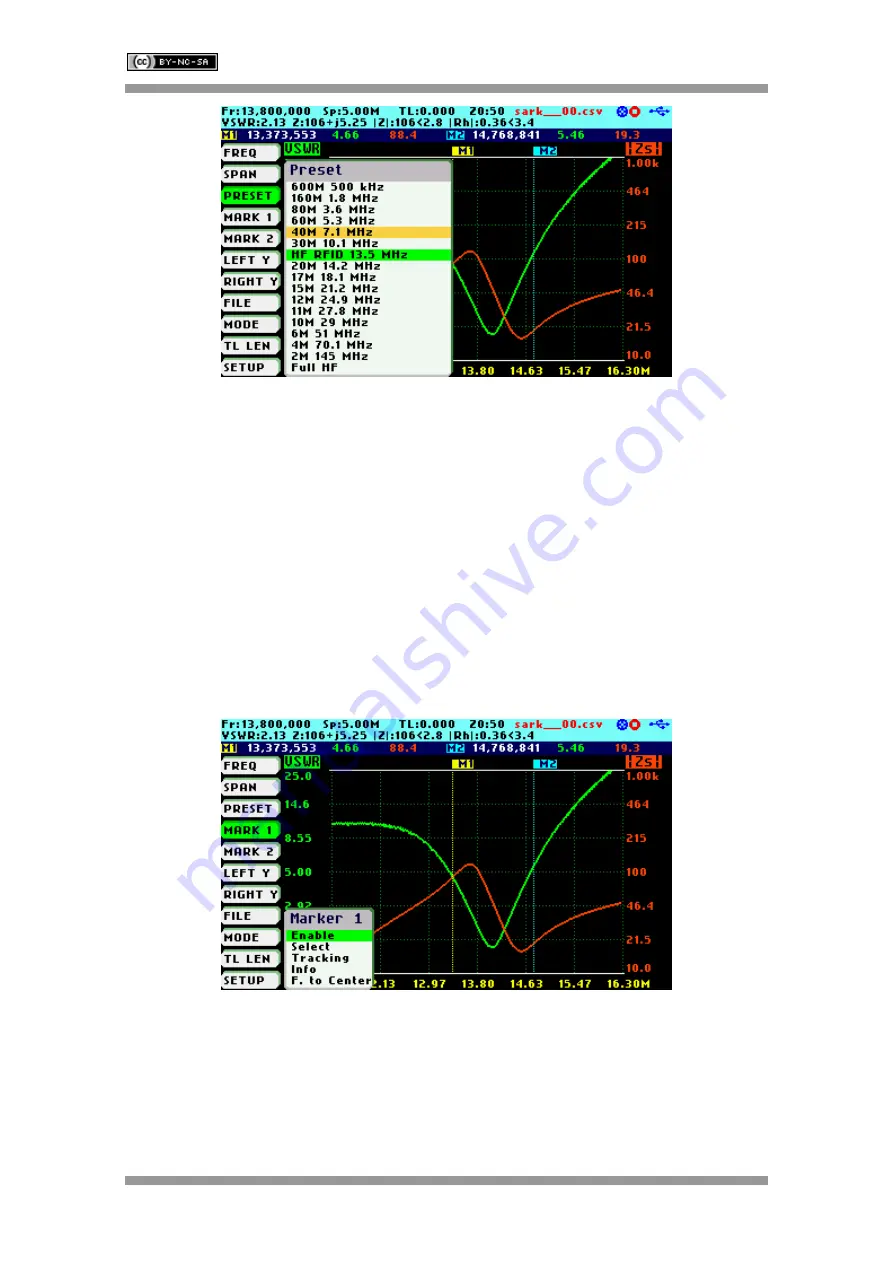
button  to  activate  the  Marker  popup  submenu.  Available  options  are: 

«Enable»

  for  activating  or  deactivating  the  marker, 

«Select»

  for  selecting  or  deselecting  the 

marker and 

«Tracking»

 for selecting the tracking mode; see screenshot below: 


The 

«Select»

  option  activates  or  deactivates  the  display  of  detailed  parameters  at  the  marker 

position. The screenshot below shows Marker1 in the selected state: 

Summary of Contents for SARK-110

Page 1: ...ed under a Creative Commons Attribution NonCommercial ShareAlike 3 0 Unported License Melchor Varela EA4FRB 2011 2020 SARK 110 Vector Impedance Antenna Analyzer User s Manual Revision 1 2 19 Updated to Firmware Version 0 9 x ...

Page 2: ...MBOLS MEANING 11 2 3 MEANS OF INPUT 11 2 4 CHANGING THE FREQUENCY 12 2 5 CHANGING THE SPAN 13 2 6 CHANGING THE START AND STOP FREQUENCIES 14 2 7 FREQUENCY PRESETS 15 2 8 USING MARKERS 16 2 9 CHANGING THE VERTICAL AXIS PARAMETER 19 2 10 SAVING AND RECALLING MEASUREMENTS 20 2 11 TAKING SCREENSHOTS 26 2 12 CHANGING THE OPERATING MODE 27 2 13 CHANGING THE SETTINGS 27 3 OPERATING MODES 41 3 1 SCALAR CH...

Page 3: ...Coil 71 4 2 2 Capacitor 73 4 2 3 Quartz Crystal 75 4 2 4 Transmission Line 77 4 3 TUNING STUBS 79 APPENDIX A THEORY OF OPERATION 82 APPENDIX B FUNDAMENTAL PARAMETERS 84 APPENDIX C UPGRADING THE FIRMWARE 86 APPENDIX D OSL CALIBRATION 87 APPENDIX E FREQUENCY CALIBRATION 92 APPENDIX F DETECTOR CALIBRATION 93 APPENDIX G FREQUENCY PRESETS FILE 97 APPENDIX H SCALE PRESETS 98 APPENDIX I CUSTOM CABLE SETT...

Page 4: ... measurement reference plane is automatically adjusted via the Open Short Load calibration procedure for higher measurement accuracy Also the analyzer implements a transmission line addition or subtraction feature in order to make antenna measurements while discounting the effect of the feed line The user interface based on a color display has been designed to be intuitive and easy to use The grap...

Page 5: ...cy Cable Test TDR Field Mode Multi band Signal Generator Computer Control and Band Scan Good accuracy over a broad range of impedances Resolves the sign of the impedance Manual and automatic positioning tracking markers Internal 2MB USB disk for the storage of measurements screenshots configuration and firmware upgrade Exports data in ZPLOTS compatible format for further analysis on a PC SARK Plot...

Page 6: ... charger automatically manages the charge cycle and stops the process when the battery is fully charged The complete charge cycle takes around 3 5 hours Slide the Power Switch button located on the right side to the ON position to turn the unit on An automatic power off feature can be set for power saving after a user specified period of inactivity Operation is controlled by four buttons and two n...

Page 7: ... When connected to an antenna system this radiation may cause interference to nearby communication systems Connect only for as long is necessary 6 On first time use it is recommended saving the factory files in a safe place Please connect the device to a PC via an USB cable and copy the files in the internal disk to a location in your PC 7 Please review carefully the instructions in Battery Mainte...

Page 8: ...fe Be sure to turn off the device to avoid additional battery use To turn off the device completely use the power switch and not the automatic power off function The device uses some battery power during the automatic power off state so the battery can be completely discharged if the device is left in this state for a prolonged period Place your device in a cool moisture free environment that s le...

Page 9: ...n a battery Do not dispose of a battery in fire or water Do not expose a battery to temperatures above 60 C 140 F Keep the battery away from children Avoid exposing the battery to excessive shock or vibration Do not use a damaged battery If a battery pack has leaking fluids do not touch any fluids Dispose of a leaking battery pack see the disposal and recycling considerations above In case of eye ...

Page 10: ...reen layouts that show specifics for each operating mode are provided in corresponding sections of this manual 1 Diagram 11 Markers information 2 Traces 12 Detailed measurements 3 Markers 13 Frequency and span settings 4 Vertical axis labeling 14 Transmission Line length setting 5 Horizontal axis labeling 15 Reference impedance setting 6 Main menu 16 Loaded data file name 7 Highlighted menu option...

Page 11: ...ing from battery Disk Disk write operation in progress 2 3 Means of Input There are four buttons and two navigation keys with push button function on the SARK 110 Navigator A Navigator A is used to navigate within the main menu left side of the screen The active option is highlighted with a green background color Navigator B Navigator B is used for changing the value of the highlighted option in t...

Page 12: ...de The Save Conf button is used to store the complete analyzer state and settings The stored state is restored automatically after the device is powered on As of firmware version v0 9 4 the analyzer state and settings are saved automatically Save Conf button can be used to launch Mode menu 2 4 Changing the Frequency There are two methods of editing the frequency center frequency for sweep modes i ...

Page 13: ...nal limits 2 5 Changing the Span There are two methods of editing the Span i Use Navigator A to highlight SPAN in the main menu on the left side of the display Press the Select button to display the popup dialog associated with SPAN Then use Navigator B to change the span The span will change according to the current span frequency multiplier that is highlighted in reverse video Use Navigator A to...

Page 14: ...AN entry mode The screenshot below shows the main menu changed to allow the entry of START and STOP frequencies Operation is similar to the FREQ or SPAN entry i Use Navigator A to highlight START or STOP in the main menu on the left side of the display Press the Select button to display the popup dialog Then use Navigator B to change the frequency The frequency will change according to the current...

Page 15: ...ncluding the amateur radio bands and other suitable settings Use Navigator A to highlight PRESET in the main menu Press the Select button to activate the Preset popup submenu Use Navigator B to highlight the desired preset Press the Select button to validate the preset selection Press any other button to cancel the operation See in the screenshot below the available presets ...

Page 16: ... diagram The markers information window in blue background shows the frequency or distance in cable test mode and the two values that correspond to the plotted values at each of the markers Use Navigator A to highlight either MARK 1 or MARK 2 in the main menu Press the Select button to activate the Marker popup submenu Available options are Enable for activating or deactivating the marker Select f...

Page 17: ...ents The following tracking modes are available Peak Min p Peak Max P Absolute Min m Absolute Max M Value Cross Any X Value Cross Up Value Cross Down v The automatic positioning of markers is activated in the Tracking sub option Select the tracking mode from any of the modes above and then the applicable parameter to track In addition a detection value must be specified for the Cross detection mod...

Page 18: ...cking mode for each marker is shown in the markers information window This information is displayed in red if either the data is not available or if the tracking condition cannot be resolved otherwise it is displayed in green The screenshot below shows Marker 1 tracking the minimum value of VSWR and Marker 2 tracking all Z crossing at 50 ohms The Info option displays detailed information of the re...

Page 19: ... the available parameters for the vertical axis Use Navigator A to highlight either LEFT Y or RIGHT Y in the main menu There are two methods of changing the selected vertical axis parameter i Press the Select button to activate the LeftY or RightY popup submenu Use Navigator B to highlight the desired submenu parameter option Press the Select button to validate the selection Press any other button...

Page 20: ... Saving and Recalling Measurements The SARK 110 has the capability to store measurements to the internal disk and recall them either to review the data later in the analyzer screen or to download the data from the USB disk to a PC for further analysis using SARK Plots or the ZPLOTS Excel application available from http www ac6la com zplots html Use Navigator A to highlight FILE in the main menu fo...

Page 21: ... Navigator A to change the character position highlighted in inverse video Press the Select button to validate the selection Press any other button to cancel the operation The Save Data File option can be also selected by pressing Navigator A when FILE is highlighted If the file base name the name without the xx numbers is changed it will be recalled in subsequent save data operations In the examp...

Page 22: ...stored data select the Load Data File submenu option A second popup submenu is displayed with a list of available files Use Navigator B to highlight the desired file Press the Select button to validate the selection Press any other button to cancel the operation Once the file is selected the data is loaded and plotted ...

Page 23: ...ured screenshots Use Navigator B to select the different bitmaps Press the Select button to finalize the operation Delete File Use the Delete file option to delete a single file on the device disk When selecting the Delete File option a popup submenu will be displayed with the list of available files Use Navigator B to highlight the desired file Press the Select button to validate the selection Pr...

Page 24: ...se the frequency resolution to be specified and uses the higher accuracy settings during the sweep scan this means a double sampling rate and an average of four measurements per single frequency point In addition this function enables a user programmable timeout for the automatic start of measurements to be specified This function is similar to the self timer function on cameras In order to use th...

Page 25: ... 2020 Enter the number of frequency points Minimum value is 258 and maximum value is 10000 Specify an optional delay for the automatic start of the measurements self timer function When a Delay is specified a countdown will commence Otherwise press the appropriate button to continue ...

Page 26: ...enter the file name By default the file name has the format sark__xx bmp where xx is an automatically assigned number To change the file name use Navigator B to change the character value and Navigator A to change the character position highlighted in inverse video Press the Select button to validate the selection Press any other button to cancel the operation Select the option Load Bitmap File or...

Page 27: ...tion Press any other button to cancel the operation As of firmware version v0 9 4 Save Conf button can be used to launch Mode menu 2 13 Changing the Settings Use Navigator A to highlight SETUP in the main menu Press the Select button to activate the Setup popup submenu see the screenshot below Use Navigator B to highlight the desired submenu setup option Press the Select button to validate the sel...

Page 28: ...option Press the Select button to flip the screen Repeat the process to flip the screen back Setup Calibration The calibration features are accessible through the Calibration submenu Setup Calibration OSL Calibration See Appendix D Setup Calibration Frequency Calibration See Appendix E Setup Detector Calibration See Appendix F Setup Calibration OSL Profile Select See Appendix D Setup Run Mode The ...

Page 29: ... reduced so using single shot mode helps to increase the battery autonomy Setup Scale The SARK 110 provides three pre defined scale values Normal High and Low as well as automatic scaling This setting defines the maximum and minimum values for each parameter on the Y axis see Appendix H This setup is valid for the Scalar Chart Field and Multi band modes Setup Z0 This setup permits the reference ch...

Page 30: ...off delay to be selected from a set of predefined times After power off press the Select button to resume operation Alternatively power off and power on the device using the Power Switch Do not use this function when storing the device for an extended period Use the power switch instead The device uses some energy from the battery during the automatic ...

Page 31: ... mode and transmission line operations require the proper setting of the cable type This setup permits the selection of cable parameters from a set of predetermined values for the most popular coaxial cables Additionally the user can specify three custom cable settings see Appendix I Setup Smith Chart Circles This setup enables the display of the constant VSWR circle or constant Q lines The screen...

Page 32: ...SARK 110 User s Manual Rev 1 2 19 January 12th 2020 32 Melchor Varela EA4FRB 2011 2020 The screenshots below show how to configure constant Q lines set at a value of Q of 1 ...

Page 33: ...12th 2020 33 Melchor Varela EA4FRB 2011 2020 Circles can be disabled by selecting None Setup Color Theme This setup permits a choice of two color themes Black or White The screenshots below shows graphs with color themes set to White and Black ...

Page 34: ...20 Setup Plot Thickness This setup allows a choice of thickness of the diagram s traces from two options Thick and Thin This option is unavailable in the Field Mode graph where traces are always set to thick The screenshots below show graphs with plot thicknesses set to Thick and Thin ...

Page 35: ...fers the choice of one of two noise reduction filters or none for the Scalar Chart Smith Chart Field and Multi band modes The Average filter minimizes the noise but at the expense of reducing the measurement speed Four samples are taken for each measurement frequency and an average from these samples is calculated ...

Page 36: ...y doubling the number of samples taken but at the expense of a slower sweep speed This enhancement of the measurements is more noticeable when using automatic scales for measurement over a small range of values The Normal low resolution option is equivalent to Normal fast option but the sweep speed is faster because the number of measurement points is reduced by half As of firmware version v0 9 7 ...

Page 37: ...EA4FRB 2011 2020 Setup Backlight This setup allows adjustment of the display s backlight intensity The range is from 1 to 10 where the higher value corresponds to the higher brightness Setup Units This setup allows configuration of distance units either in meters or feet ...

Page 38: ...r Varela EA4FRB 2011 2020 Setup Stubs This setup allows configuration of the fraction of wavelength and velocity factor for the tuning stubs feature see section 4 3 Setup Reset to Factory Defaults This setup permits resetting the analyzer to its default settings ...

Page 39: ...the Select button to format the disk or any other button if only a reset to factory defaults is required It is recommended that the disk contents are backed up to a PC as most of the files will be lost during the format Only the Detector Calibration file detcalib dat and the file associated with the selected OSL Calibration profile are preserved ...

Page 40: ...SARK 110 User s Manual Rev 1 2 19 January 12th 2020 40 Melchor Varela EA4FRB 2011 2020 Setup About The About screen displays copyright information firmware release number disk size and free space ...

Page 41: ... menu option 15 Calibration status 7 Main menu 16 Run Hold status 8 Markers information 17 USB Battery status 9 Detailed measurements The Scalar Chart mode provides functionality for impedance measurements of antennas transmission lines and RF circuits The analyzer performs reflection measurements within a user specified frequency range defined by the frequency and the span The two user selectable...

Page 42: ...the plot continuously if the Run Mode in the SETUP menu is set to Continuous The sweep can be stopped at any time by pressing the Run Hold button If the Run Mode in the SETUP menu is set to Single Shot the sweep automatically stops on completion of a single pass Press the Run Hold button to start a new sweep The results of the measurements are kept in internal memory and plotted on the display to ...

Page 43: ...15 Calibration status 7 Highlighted menu option 16 Run Hold status 8 Markers information 17 USB Battery status 9 Detailed measurements The Smith Chart mode is equivalent to the Scalar Chart mode but in this case the complex reflection measurements for the user specified frequency range are displayed in a Smith Chart diagram Use Navigator A to highlight MODE in the main menu Press the Select button...

Page 44: ...ce shows the reflection coefficient for the frequencies below the center frequency and red trace for the frequencies above the center frequency This allows easily identifying the position of the center frequency The impedance measurement data and marker positions are preserved when changing to the Scalar Chart mode and vice versa For example markers can be set at the zero reactance points of the p...

Page 45: ...SARK 110 User s Manual Rev 1 2 19 January 12th 2020 45 Melchor Varela EA4FRB 2011 2020 ...

Page 46: ...m 14 Reference impedance setting 6 Parallel circuit equivalent 15 Calibration status 7 Parallel resistance and equivalent inductance or capacitance values 16 Run Hold status 8 Highlighted menu option 17 USB Battery status 9 Main menu The Single Frequency mode provides impedance measurements at a single frequency All the measured fundamental parameters at the selected frequency are shown in the dis...

Page 47: ...s the measurements continuously unless it is paused by pressing the Run Hold button The measurements can be resumed at any time by pressing the same button again This mode offers optional VSWR audio feedback When activated by the menu option AUDIO the analyzer produces beeps of different duration as an indication of VSWR The audio is produced only for VSWR values between 1 0 and 10 0 and the beep ...

Page 48: ...v 1 2 19 January 12th 2020 48 Melchor Varela EA4FRB 2011 2020 Select DISP Graphic for the graphic presentation Select DISP Big VSWR for a presentation mode where the VSWR readings are displayed with a big font for easy viewing ...

Page 49: ...og meters to indicate the readings of VSWR and Zs and with the numeric values shown below the meters with a big font for easy viewing As of firmware version v0 9 4 Single Frequency mode allows taking measurements at specified time intervals that are recorded sequentially in a text file This feature is designed for scenarios where it is necessary analyzing variations in measurements over time The s...

Page 50: ...760 0 067721 13 246773 0 458615 0 031179 6605 933594 0 020885 6 415576 21 504335 1 27615 13 550000 1 145240 57 034416 1 744661 57 087784 1866 247437 57 061092 1 752109 23 387812 11 693906 0 067703 12 995469 0 458373 0 030590 6732 399902 0 020492 6 293781 21 920479 2 28615 13 550000 1 144766 57 006538 1 757563 57 060726 1850 764648 57 033627 1 765921 23 414286 11 707143 0 067497 13 140868 0 455587 ...

Page 51: ...rs information 17 Run Hold status 9 Detailed measurements 18 USB Battery status Cable Test or Time Domain Reflectometer TDR mode is intended to identify potential coaxial cable faults that could disrupt signal transmission Unlike native TDR test equipment the method of measurement in the SARK 110 is based on the theory of Frequency Domain Reflectometry FDR The analyzer makes swept reflection measu...

Page 52: ...ed continuously or in single shot mode and controlled by the Run Hold button but in this case it takes some seconds for the results to show on the display due to the time it takes to make a full frequency sweep The distance from the start of the cable to any discontinuity may be found by moving one of the markers over the discontinuity of interest The distance of the fault from the start of the ca...

Page 53: ...SARK 110 User s Manual Rev 1 2 19 January 12th 2020 53 Melchor Varela EA4FRB 2011 2020 Figures below illustrate the responses of known discontinuities ...

Page 54: ... Response Unity reflection Unity reflection Open Unity reflection 180º Unity reflection 180º Short Positive peak Positive level shift Resistance R Z0 Negative peak Negative level shift Resistance R Z0 Positive then negative peaks Positive peak Inductance Negative then positive peaks Negative peak Capacitance Display ...

Page 55: ...isk write operation in progress 6 Maximum and minimum values 14 Calibration status 7 Highlighted menu option 15 Run Hold status 8 Main menu 16 USB Battery status Field Mode is equivalent to the Scalar Chart mode but with a more visible presentation aimed at operation in the field especially if combined with the White color theme Frequency and magnitude of maximum and minimum points in the trace ar...

Page 56: ... main menu Press the Select button to activate the Mode popup submenu and use Navigator B to highlight Field submenu mode option Finally press the Select button to enter into Field mode Operation is similar to the scalar chart mode with some limitations such as only one trace is plotted and the markers feature is not available ...

Page 57: ... status 7 Detailed measurements at center frequency of selected band The Multiband mode is a unique feature of the SARK 110 to display the plot of an impedance parameter in four scalar charts simultaneously This feature is ideal for tuning multiband antennas Additionally it can be used to display different views of the same band as a kind of zoom feature Use Navigator A to highlight MODE in the ma...

Page 58: ...race only The main menu BAND option permits selecting the active band The selected band is highlighted in the frequency axis of the band graph Frequency and span settings are applied to the selected band The detailed measurements at the top of the screen correspond to the selected band as well The CHART menu option allows enabling or disabling specific charts The screenshots below show the Band 4 ...

Page 59: ...chor Varela EA4FRB 2011 2020 The Save Data File function operates in the same way as in other modes The data for each band of the enabled charts is stored sequentially in individual files The Load Data File loads the data from a file to the selected band only ...

Page 60: ...menu and use Navigator B to highlight Signal Generator submenu mode option Finally press the Select button to enter into Signal Generator mode The screenshot below shows the signal generator screen in continuous frequency operation mode The screen includes the programmed frequency in Hertz and the output power level expressed both in dBm and volts Frequency can be changed as usual see chapter 2 4 ...

Page 61: ... state the level graph and power level indicators change to red Signal generation can be resumed at any time by pressing the Run Hold button again In frequency sweep mode the signal frequency will sweep between two user defined frequencies To change the sweep parameters use Navigator A to highlight SWEEP in the main menu and press the Select button to validate the different sweep parameters ...

Page 62: ...rator stops after a single sweep o Count Signal generator stops when number of sweeps reach count Count Function o Linear Linear frequency increase or decrease o Log Logarithmic frequency increase or decrease o Bi Linear Start Stop Stop Start sweep Linear o Bi Log Start Stop Stop Start sweep Log Start Frequency o Start Hertz Stop Frequency o Stop Hertz Number of points Number of steps between star...

Page 63: ...ion mode the tone frequency is 1 kHz and the frequency deviation is 2 5 kHz As of firmware version v0 9 4 the Signal Generator mode supports a reception mode that can be used measuring the power level of an input signal Select MODUL RX Mode for enabling the reception mode and then the desired bandwidth The power level is shown as a bar chart and in text format As of firmware version v0 9 5 the bar...

Page 64: ...all a dedicated driver since communication is implemented using the standard USB HID interface Use Navigator A to highlight MODE in the main menu Press the Select button to activate the Mode popup submenu and use Navigator B to highlight Computer Control submenu mode option Finally press the Select button to enter into Computer Control mode The analyzer establishes the USB link when it is connecte...

Page 65: ...2020 The command interface specification is open for anyone wishing to develop client software Source code examples of the communication interface are available for different operating systems This information is available at the following link http www sark110 com commands interface ...

Page 66: ...scan for nearby signals that may interfere with the measurements or to measure the power of the spectrum of signals in a lab environment Operation is similar to the Scalar Mode and uses the same frequency settings There are two traces left axis shows the signal power level Pwr and right axis shows the peak hold Peak Press the Run Hold button twice to reset the Peak trace at any time The sweep spee...

Page 67: ...d as a Spectrum Analyzer so there are a number of limitations when used for this function such as The power level is not calibrated so the measured power levels are not necessarily accurate The input mixer has no image suppression so on narrow spans the image will appear at an equal amplitude see the next screenshot ...

Page 68: ...specify up to three custom cable types The selection of the cable is available in the menu SETUP Cable Type see the screenshot below The transmission line length has to be entered into the TL LEN menu option within the Main menu Use negative quantities for Subtract operations transpose to load and positive quantities for Add operations transpose to input The pop up edit dialog is activated by pres...

Page 69: ...nated at the far end Set the SARK 110 to Smith Chart mode and select PRESET Full HF The Smith Chart will show a spiral from infinite impedance and going towards the center When setting negative length values this spiral will be progressively unrolled and transposed to the infinite impedance point when the exact length will be set Then if a load is connected at the cable far end the presence of the...

Page 70: ...SARK 110 User s Manual Rev 1 2 19 January 12th 2020 70 Melchor Varela EA4FRB 2011 2020 ...

Page 71: ... extension cable being employed Please refer to Appendix D on how to carry out the steps for OSL calibration The measurement results can be saved in a file in tabular format or as a screenshot The Circuit Models function is only available in the Single Frequency Mode Select MODE Single Frequency to change to the Single Frequency mode Then select CMODEL in the main menu and the desired function in ...

Page 72: ...ts are shown on the screen A screenshot can be captured by selecting The figure below describes the measured parameters The internal procedure performed by the analyzer is as follows the analyzer measures the impedance at 1 MHz and at the desired operating frequency e g 13 56 MHz Then it searches for the antenna s self resonant frequency and measures the impedance at that point The following param...

Page 73: ...t resistance at the self resonant frequency The antenna capacitance is calculated with the following equation 2 2 1 Fra La Ca The series equivalent resistance of the antenna at the operating frequency Fop 13 56 MHz is calculated with the following equation Rp La Fop Rs Ra 2 2 The quality factor is calculated using the following equation Ra La Fop Qa 2 4 2 2 Capacitor This function determines the e...

Page 74: ...he results are shown on the screen A screenshot can be captured by selecting The figure below describes the measured parameters The internal procedure performed by the analyzer is as follows the analyzer measures the impedance at 1 MHz and at the desired operating frequency Then it searches for the self resonant frequency and measures the impedance at this point The following parameters are extrac...

Page 75: ...Ca La The quality factor is calculated using the following equation 2 1 Ra Ca Fop Qa 4 2 3 Quartz Crystal This function determines the equivalent circuit model of quartz crystals Detailed usage of this function is described in the Application Note available at http www sark110 com application notes equivalent circuit determination of quartz crystals The measurement procedure is as follows Select t...

Page 76: ...ncies are identified in the singularities where the impedance changes from pure capacitive phase value close to 90º to pure inductive phase value close to 90º The resonant frequencies are then obtained from the frequency points where the measured phase value is close to zero After determining the series and parallel resonant frequencies the series resistance Rs at the series resonant frequency is ...

Page 77: ...s Q 1 4 2 4 Transmission Line This feature allows you to automatically measure different parameters having to do with transmission lines namely The line s characteristic impedance Z0 The true velocity factor The matched line loss in terms of dB over the total line length and in dB 100m The measurement procedure is as follows Select the file name and press or select when the results are not to be s...

Page 78: ... Enter the stop frequency Enter the transmission line length Connect the transmission line terminated with an open circuit Press the appropriate button to continue or to exit Connect the transmission line terminated with a short circuit Press the appropriate button to continue or to exit ...

Page 79: ...sc Zoc Z 0 The calculation of the Velocity Factor VF and matched loss is more convoluted and will not be explained here The relevant information is that the VF is provided at the upper frequency and the matched loss is provided at the maximum frequency and the arithmetic mean for all frequency points 4 3 Tuning Stubs The SARK 110 facilitates making and other coaxial stubs with the help of Markers ...

Page 80: ...t mode select start frequency of 1 MHz and stop frequency above the desired frequency in this case it is set to 30 MHz Move Marker 2 to the frequency closed to the desired frequency 20 MHz and select MARK 2 Info At the bottom of the dialog box Len indicates the calculated electrical length of the coax cable ...

Page 81: ...ove the Marker 1 to the point where Zs or Xs crosses zero In this case this frequency point is at 16 399 MHz Select MARK 1 Info The readings show a length of 3 016m and a length difference M1 M2 of 0 543m which is the excess length of the piece of coax cable Cut a piece slightly shorter than this value and repeat the process until getting to the expected value ...

Page 82: ... operates at the specified test frequency and the other is programmed to operate just 1 kHz above it which is the value of the intermediate frequency The DDS has an internal oscillator driven by an external 24 MHz crystal and is able to multiply this clock internally by a user configurable factor of 4 to 20 so the maximum internal clock frequency is 480 MHz In general the DDS can be configured to ...

Page 83: ... the 1 kHz I F signal which is then amplified and filtered with a bandpass filter before digitizing Identical mixer and amplifier circuits are used for both the voltage and current sensing paths Any small differences in the gain and phase shift of these two signal paths are taken care of by the calibration process The core of the analyzer is an STM32F103 microcontroller from STMicroelectronics Thi...

Page 84: ...the ratio of the amplitude of the voltage to the amplitude of the current expressed in degrees VSWR Voltage Standing Wave Ratio It is a measure of how efficiently radio frequency power is transmitted from a power source through a transmission line and into a load for example from a power amplifier through a transmission line and into an antenna RL Return Losses S11 dB Return loss is the negative o...

Page 85: ... Ref Pwr Percentage of Reflected Power 100 2 Rho RPwr Q Quality Factor It is defined as the ratio of the energy stored in a component to the energy dissipated by the component R X Q Cs Series Capacitance Equivalent series capacitance at the measurement frequency Ls Series Inductance Equivalent series inductance at the measurement frequency Cp Parallel Capacitance Equivalent parallel capacitance at...

Page 86: ...ocate the SARK s USB flash drive unit using the File Explorer of your PC 3 Copy the firmware file e g SARK110 APP x y z dfu to the SARK s USB flash drive unit 4 Do a safe eject of the SARK s USB flash drive unit from your computer 5 Power off the SARK 110 and power it on again while simultaneously holding down the Run Hold button 6 The Device Firmware Upgrade screen prompts you to install the firm...

Page 87: ... please refer to Setup Z0 in the chapter 2 13 The place where these loads are connected during the calibration is called the Reference Plane The analyzer performs a series of measurements with these loads calculating error coefficients that are stored in a file that is automatically loaded each time the analyzer is run These error coefficients are used to correct the measured values The number of ...

Page 88: ... Melchor Varela EA4FRB 2011 2020 After selecting the calibration profile the profile characteristics are shown in a popup dialog Once the calibration profile has been selected choose SETUP Calibration OSL Calibration to start the OSL calibration procedure ...

Page 89: ...th 2020 89 Melchor Varela EA4FRB 2011 2020 The calibration procedure is as follows Enter the start frequency default is the lower frequency limit Enter the stop frequency default is the upper frequency limit Enter an optional name for the profile ...

Page 90: ...reen denotes load good status Press the appropriate button to continue or to exit The calibration progress will be shown in the display bar Connect the short circuit load Load status is indicated by the color of the Rh indicator Green denotes load good status Press the appropriate button to continue or to exit The calibration progress will be shown in the display bar ...

Page 91: ... reference load Load status is indicated by the color of the Rh indicator Green denotes load good status Press the appropriate button to continue or to exit The calibration progress will be shown in the display bar Press the appropriate button to apply the new calibration settings or to cancel them ...

Page 92: ...requency while measuring it with an accurate frequency counter or alternatively zero beat it against WWV Use Navigator B to change the frequency The frequency will change according to the current frequency multiplier that is highlighted in reverse video Use Navigator A to change the frequency multiplier position if needed When an exact 10 MHz output is obtained press the Select button to permanent...

Page 93: ...tional detector test phase to check the detector circuits For Detector calibration the Short load is connected directly at the Test port see the figure below For the optional detector test phase the following loads are required 50 100 and 200 ohm As of firmware version v0 9 4 the calibration requires a 50 ohm load in addition to the Short load Before performing this operation it is strongly recomm...

Page 94: ...t detector indicators Green denotes a load good status Press the appropriate button to continue or to exit The calibration progress will be shown in the display bar As of firmware version v0 9 4 Connect the 50 ohm Load The calibration is completed The calibration coefficients are shown at the bottom of the screen for information Press the appropriate button to apply the new calibration settings or...

Page 95: ... Detector Test or to exit Connect the 0 ohm load Load status is indicated by the color of the voltage and current detector indicators Green denotes a load good status Press the appropriate button to continue or to exit Connect the 50 ohm load Load status is indicated by the color of the voltage and current detector indicators Green denotes a load good status Press the appropriate button to continu...

Page 96: ...d current detector indicators Green denotes a load good status Press the appropriate button to continue or to exit Connect the 200 ohm load Load status is indicated by the color of the voltage and current detector indicators Green denotes a load good status Press the appropriate button to continue or to exit Press the appropriate button to repeat the test or to exit ...

Page 97: ... frequency o def_mul_span default multiplier for setting the span o marker1_freq default marker 1 frequency specified in MHz o marker2_freq default marker 2 frequency specified in MHz Example 600M 500 KHz 0 1 0 9 3 4 0 2 0 5 160M 1 8 MHz 1 3 2 3 4 5 1 8 2 0 80M 3 6 MHz 1 6 5 6 5 6 3 5 3 8 60M 5 3 MHz 3 3 7 3 5 6 5 2 5 5 40M 7 1 MHz 5 1 9 1 5 6 7 0 7 2 30M 10 1 MHz 8 1 12 1 5 6 10 1 10 2 HF RFID 13...

Page 98: ...0 Linear Lp 100 100 Linear High Min Max Scale Rs 10 5000 Log Xs 2500 2500 Linear Rp 10 5000 Log Xp 2500 2500 Linear Zs 10 5000 Log Zs 100 100 Linear VSWR 1 00 100 00 Log RL 60 0 Log CL 0 30 Log Rho 0 1 0 Linear Rho 190 190 Linear Rp 0 100 Linear Q 0 50 Linear Cs 100000 100000 Linear Ls 1000 1000 Linear Cp 100000 100000 Linear Lp 1000 1000 Linear Low Min Max Scale Rs 0 250 Linear Xs 125 125 Linear ...

Page 99: ...ef txt Scale High scal_hig txt Scale Low scal_low txt Scale Auto scal_aut txt The files must contain an entry for each parameter with the following syntax min max log Y N Note that logarithmic scales do not accept negative ranges Example file name scal_def txt 10 1000 Y Rs 500 500 N Xs 10 1000 Y Rp 500 500 N Xp 10 1000 Y Zs 100 100 N Zs 1 00 25 00 Y VSWR 40 0 N RL 0 20 N CL 0 1 0 N Rho 190 190 N R...

Page 100: ...ab txt and the format for each cable entry in the file is as follows legend Z0 VF K0 K1 K2 Where o legend string to be display in the preset menu max length 20 o Z0 characteristic impedance o VF velocity factor o K0 DC resistance dB 100ft o K1 coefficient for conductor loss dB 100ft o K2 coefficient for dielectric loss dB 100ft Example Test cable 1 50 0 68 0 063897 0 192292 0 000051 Test cable 2 6...

Page 101: ...o 10 dBm Test port connector type MCX included MCX to SMA adaptor Measured parameters VSWR Rs Xs Rp Xp Zs Zs RL CL Rho Rho Ref PWR Q Cs Cp Ls Lp Reactance sign measurement Yes Narrowband detectors Two narrowband detectors Two 12 bit ADCs Return loss dynamic range 0 to 60 dB Measurement limits VSWR 100 1 Z 100K R 100K X 100K Rho 0 98 C 100 nF L 100 mH 180 ϴ 180 Sweep frequency resolution 258 points...

Page 102: ...rge via USB Modes Scalar chart Smith chart Single frequency Multiband charts Cable test TDR Signal generator Band scan Special functions Configurable presets for amateur bands Markers Save load data Save screenshots Deep sweep save with timer function VSWR Audible feedback Transmission line add subtract Circuit modes loop antenna capacitor crystal transmission line Automatic LC matching calculator...

Page 103: ...sing the DesignSpark PCB tool Product information is available at www designspark com pcb The analyzer firmware has been developed using the Lite edition of the Atollic TrueSTUDIO for STM32 Product information is available at www atollic com FAT File System was provided by the ChaN FatFs module The STM32 firmware and USB library are provided by STMicroelectronics Many thanks to Dan Maguire AC6LA f...

Reviews: