6-54
6.3
Evaluating Measured Data
Displaying the
measured data
After the measured data has been retrieved from the logger (see section 6.1), the
progression of the measured values can be illustrated in a diagram and, by this
means, can be easily evaluated.
Proceed as follows to display the data of a specific logger:
Step
Action
1
Mark the logger whose data you want to display in the logger tree.
Proceed in one of the following ways:
o
Select Logger -> Display data from the menu bar.
o
Right-click on the logger in the logger tree and select Display
data from the context menu.
2
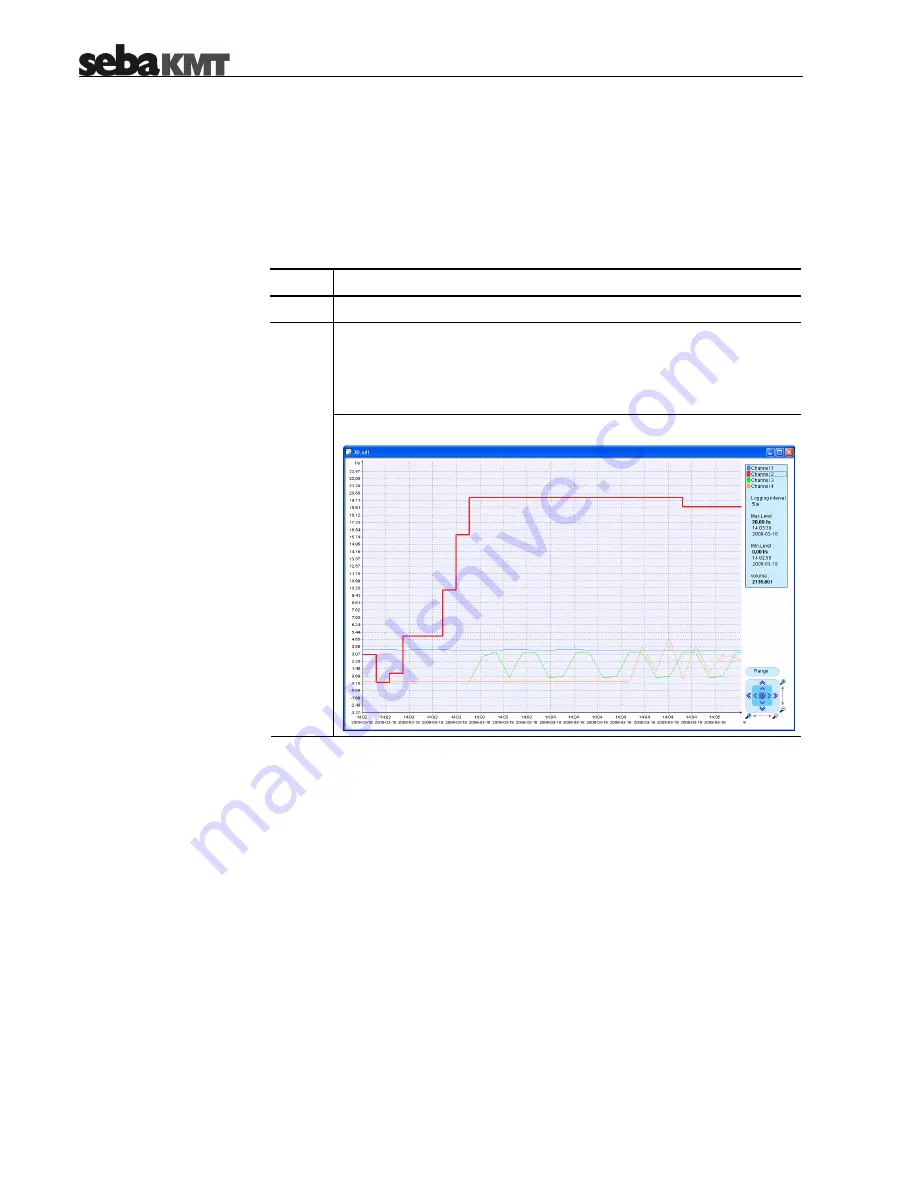
Result: The following window appears:
Diagram
The curves of the different channels share in one diagram. The X-axis represents the
timeline while the Y-axis represents the measured values.
By clicking on a curve, the channel is selected and the curve is shifted to the
foreground.
By double-clicking the diagram, the diagram properties can be changed.
Info bar
If you click on a channel in the blue info bar at the top right of the window, the
respective curve is shifted to the foreground and some characteristics of the channel
are displayed in the info bar.
The values shown in the info bar result only from the visible part of the curve. Any
maximum or minimum values outside of the current visible time range are not
considered.
By selecting a channel / curve, the unit of the Y-axis is adapted to the respective
measurement. However, the scaling does not change.
Summary of Contents for Sebalog D
Page 2: ......

