Scientific calculator – Instructions for use
| 5
–
Coordinate conversion.
(Pol (
x,y
), Rec (
r,θ
)).
Example:
to convert polar coordinates (
r
= 2,
θ
60°) to rectangular coordinates (
x,y
) (Deg).
x
=
(Rec( )
y
=
(F)
Press
(E) to display the value of
x
, or
(F) to display the value of
y
.
–
Engineering notation calculations.
Example 1:
to convert 56,088 meters to kilometers
56,088 × 10
3
(km)
Example 1:
to convert 0.08125 grams to miligram
81.25 × 10
3
(mg)
STATISTICAL CALCULATIONS –
STANDARD DEVIATION
Use the
key to enter the SD mode when you
want to perform statistical calculations using
standard deviation.
SD
__________________
In the SD mode and REG mode the
key operates
as the DT key.
Always start data input with
(CLR)
(Sci) to clear the statistical memory. Input data
using the following key sequence: <
x
-data>
(DT). Input data is used to calculate values for
n
,
Σ
x
,
Σ
x
-2
, , σ
n
and σ
n
-1
, which you can recall using the
key operations in the table further on.
STATISTICAL CALCULATIONS –
REGRESSION CALCULATIONS
Use the
key to enter the REG mode when you want
to perform statistical calculations using regression.
REG
_________________
In the SD mode and REG mode, the
key
operates as the DT key. Entering the REG mode
displays screens like the ones shown below.
Press the number key , or which corresponds
with the type of regression you want to use.
(Lin):
Linear regression
(Log):
Logarithmic regression
(Exp):
Exponential regression
(Pwr): Power regression
(Inv): Inverse regression
(Quad): Quadratic regression
Always start data input with
(CLR)
(Sci) to clear the statistical memory. Input data
using the key sequence shown as follows: <
x
-data>
<
y
-data>
(DT). The values produced by a
regression calculation depend on the values input,
and results can be recalled using the key operations
shown in the following table.
Value to display
Key sequence
Σ
x
2
(
)
Σ
x
(
)
n
(
)
Σ
y
2
(
)
Σ
y
(
)
Σ
xy
(
)
(
)
x
σ
n
(
)
x
σ
n
-1
(
)
(
)
y
σ
n
(
)
y
σ
n
-1
(
)
Regression coefficient A
(
)
Regression coefficient B
(
)
Except for quadratic regression
Correlation coefficient
(
)
(
)
(
)
The following table shows the key sequence to be
used for displaying results of quadratic regression.
Value to display
Key sequence
Σ
x
3
(
)
Σ
x
2
y
(
)
Σ
x
4
(
)
Regression coefficient C
(
)
x
1
(
)
2
(
)
(
)
The values in the table above can be used within
terms in the way variables are used.
–
Linear regression.
The formula for linear
regression is
y
= A + B
x
.
Example:
air pressure and temperature.
Temperature
Air pressure
10°C
1003hPa
15°C
1005hPa
20°C
1010hPa
25°C
1011hPa
30°C
1014hPa
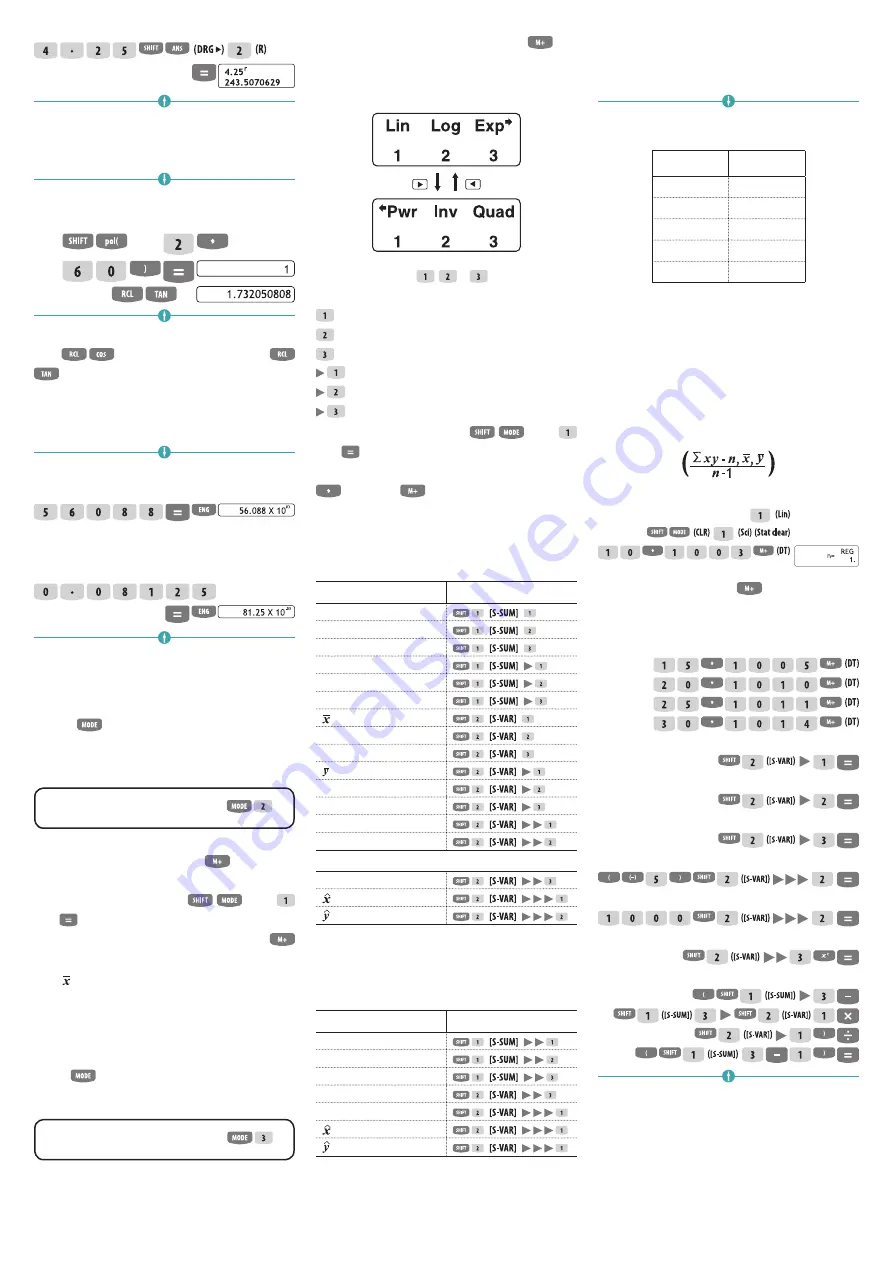
Carry out the linear regression to determine
the terms and the correlation coefficients of the
regression formula for the data shown here. Then
use the regression formula to estimate the air
pressure at -5°C and the temperature at 1000hPa.
Finally calculate the degree of certainty (
r
2
) with
the random test covariance:
In REG mode:
Note: each time you press
(DT) to register an
input the quantity of data input is displayed as the
n
value.
Regression coefficient A = 997,4
Regression coefficient B = 0,56
Correlation coefficient -0,982607368
Air pressure at -5°C = 994,6
Temperature at 1000hPa = 4,642857143
Degree of certainty = 0,965517241
Random test covariance = 35.
–
Logarithmic, exponential and inverse
regression and power inversion.
Use the
same key sequence as for linear regression to
display the results for these regression types. The
regression formulas for each regression type are:


