5
Set Up
- Unpack the instrument from shipping carton. Retain packing material for future storage/
protection/shipping.
- Place the instrument indoors on a solid surface in an environment where the temperature
is stable. Be certain that the instrument is not subjected to direct discharge from heating or
air conditioning vents, or water bath circulator exhaust. Drafts can have an adverse affect on
temperature stability.
- Insert the appropriate plug end into the power receptacle located on the underside of the
instrument. Plug the opposite end of the power cord into a receptacle to supply the instrument
with power (Fig 1). Supply voltage: 100 - 240VAC
50/60HZ.
- Turn the instrument on by activating the power switch
located on the right side cover (Fig 2).
- Allow the instrument to reach a stable operating
temperature in the on position for a minimum of
one hour before attempting calibration or to measure
samples.
Fig 1
Fig 2
Sample Analysis
Cleanliness, sample temperature equilibration and shadowline clarity is essential to obtain the
greatest possible accuracy from the Mark III refractometer. Highly viscous samples or samples
that contain trapped air bubbles may not produce a sharp shadowline. In these cases, applying
the sample with a rubber spatula to squeeze out trapped bubbles or lifting the upper prism sev-
eral times to remove the trapped air is required. The following are the required steps to properly
analyze a sample:
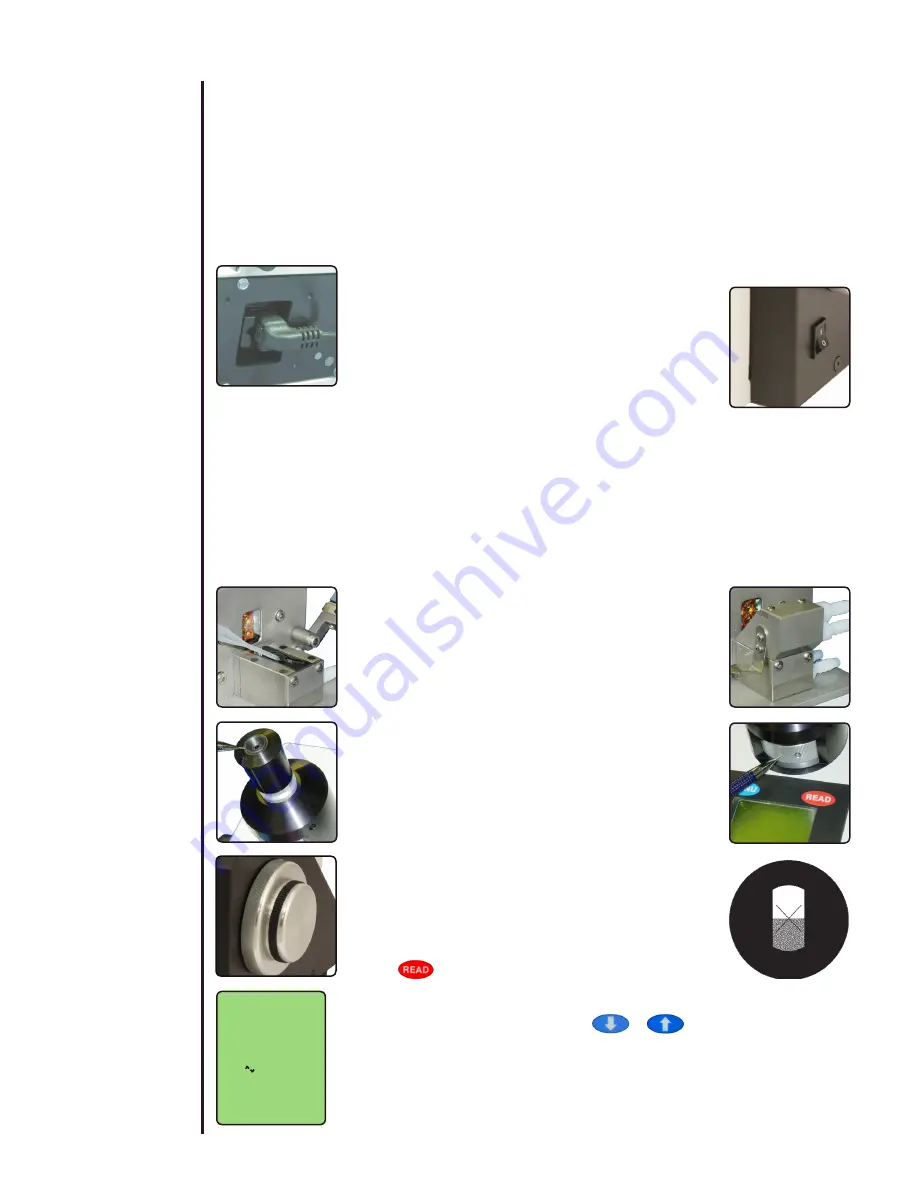
Raise
the upper prism and apply the sample to a
clean measuring surface (Fig 3).
Gently
lower the upper prism to spread the sample
evenly and to eliminate trapped air bubbles (Fig 4).
Allow
the sample to reach temperature equilibration
with the instrument.
View
the image through the focusing eyepiece (Fig 5).
If required, rotate the eyepiece to bring the image of the
“X” pattern into focus.
If
a non-distinct shadowline containing color is viewed,
rotate the color dispersion correction wheel to eliminate
or reduce the color dispersion (Fig 6). Under optimal
conditions, the shadowline area will appear to be sharp
and black with a bright area above.
While
viewing the image, center the shadowline in the
“X” pattern by rotating the shadowline adjustment knob
(Fig 7). For measuring consistency, always approach
the center of the “X” pattern with the shadowline from
below. Once the image has been centered (Fig 8)
press .
To
the left is a representation of a displayed value. To
change reading mode, press either or to
advance through all available mode options.
1.3330
20.00
o
C
Sucrose
I I Index-TC
Time
Date
Temp
o
C
Fig 5
Fig 3
Fig 4
Fig 7
Fig 8
Fig 6


