background image

MULTI-PURPOSE PROBE


89 


8.


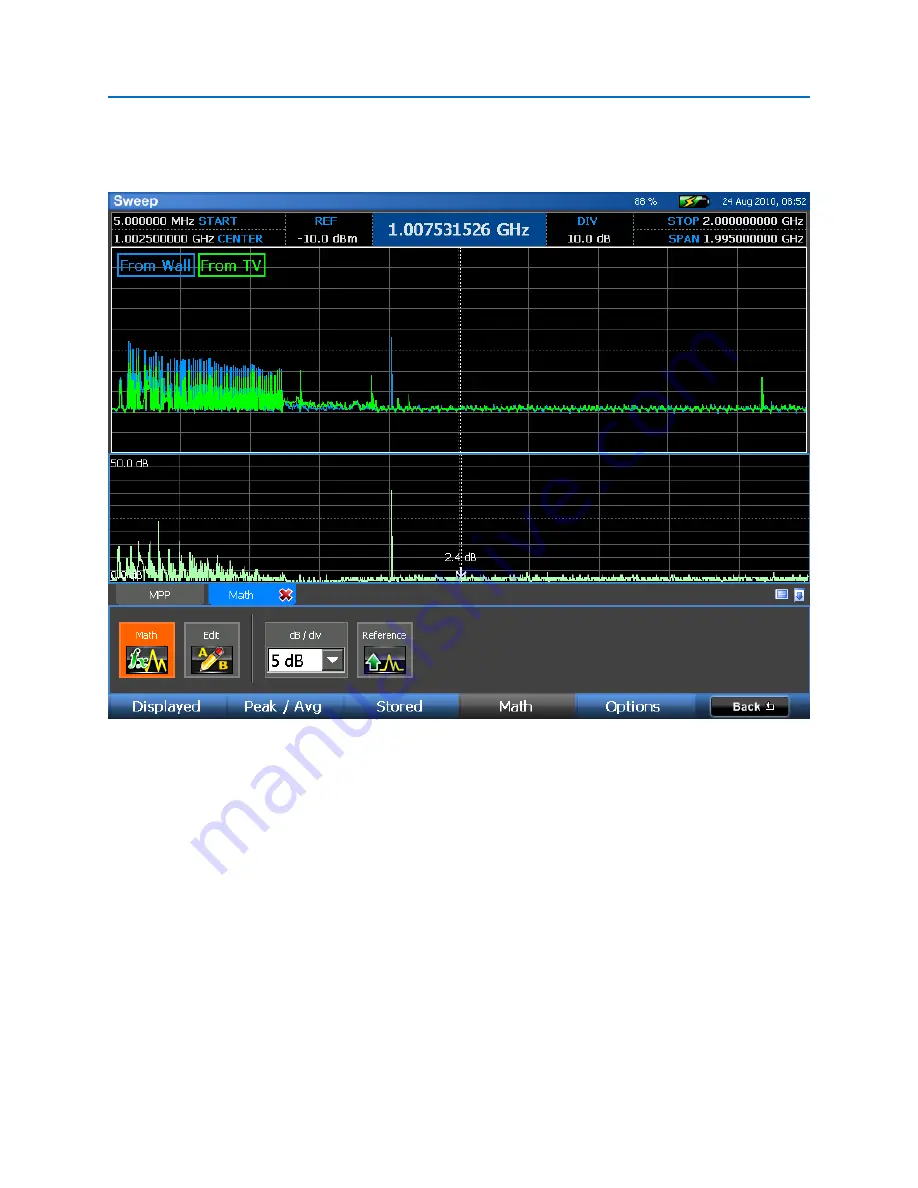
Repeat step 5 to save a Peak Trace from Port B.  The two saved peaks can now be compared to 
identify possible suspect signals.  A math trace can also be performed on these two peaks (see 
page 42) 


Notes: 

-


Always verify the directionality of any suspicious signal by connecting each side up individually. 


Coax (Single-Ended) 

The coax connectors on the MPP can also be used for single-ended measurements.   

Summary of Contents for OSCOR Blue

Page 1: ...m Analyzer User Manual Research Electronics International LLC 455 Security Drive Cookeville TN 38506 U S A 800 824 3190 US Only 1 931 537 6032 www reiusa net Copyright Research Electronics Internation...

Page 2: ......

Page 3: ...the appropriate equipment REI offers the world s largest commercially available Technical Security training facility Training courses include classroom instruction and hands on exercises where student...

Page 4: ...cation purposes and are trademarks or registered trademarks of their respective holders U S PATENTS 6 397 154 7 058 530 Additional Patents Pending NOTE The overall effectiveness of any technical surve...

Page 5: ...te and Time 20 Touch Screen Calibration 21 Saving Screen Shots to Thumb Drive 21 File Operations 21 Using the Storage Manager 22 Resetting to Factory Defaults 24 Setting up the Tuner 24 Preset Spans 2...

Page 6: ...rload Sweep Mode 63 ANALYZE MODE 65 Analyze Mode Screen Elements 65 Setting up the Analyze Mode Display 66 Demodulating an analog signal in Analyze Mode 66 Changing the Scope Display in Analyze Mode 6...

Page 7: ...84 OSCOR Unit Operations with the MPP connected 86 Selecting an MPP Input 86 Coax In Line 87 Coax Single Ended 89 CCP Carrier Current Probe 91 Receiver Overload MPP Carrier Current Probe 93 VLF Loop...

Page 8: ...ectrostatic discharge ESD to the whip antenna connector In an area where static discharges are likely such as in dry conditions or on carpeting avoid contact with this connector located on the top of...

Page 9: ...us patterns of solid and blinking colors to indicate successful initialization and self test This is a list of the various colors the power button will display during operation and what each color ind...

Page 10: ...ected START STOP CENTER SPAN or CURSOR Also provides ability to adjust various control parameters 7 TAB used to navigate between fields such as within signal lists or dialog screens 8 UP DOWN LEFT RIG...

Page 11: ...luded SHIFT operations include smaller blue text with the name of the SHIFT operation 16 GHz MHz kHz used for inputting frequencies into the START STOP CENTER SPAN and cursor fields 17 NUMBER KEYS use...

Page 12: ...or REI supplied accessories such as the Multi Purpose Probe see page 84 7 0 8 GHz Aux RF In Optional RF input for user supplied antennas Must manually be switched in the menu see page 28 Other Inputs...

Page 13: ...ng data A USB keyboard or mouse may also be connected to the unit to facilitate entry for the various fields 14 Compact Flash slot allows connection of compact flash card for saving data 15 USB B conn...

Page 14: ...ation The Directional Antenna is not included in some OSCOR models versions If the unit purchased did not include this antenna it can be purchased by contacting REI or an Authorized REI reseller 19 Mu...

Page 15: ...Two 2 exercises are provided 1 Listen to a radio station 2 Basic methods to detect threat transmitters Exercise 1 Listen to a Radio Station This exercise has two parts The purpose is to gain a quick u...

Page 16: ...cy As you zoom in the selected frequency will center itself on the screen Press SWEEP ANALYZE to enter Analyze mode Press Mute or Vol Up to listen to the radio station To listen to other known signals...

Page 17: ...he FM band by touching the screen within the very top screen division and dragging with your finger or the stylus in a downward motion If you zoom in too far simply touch the screen within the very bo...

Page 18: ...on of the screen Also by default three traces are displayed in the spectral graph in Analyze Mode the real time trace the peak trace and an average trace Using the techniques of this exercise you shou...

Page 19: ...e which is yellow by default and the peak trace which is red by default Notice the Sweep Countsdisplayed in the top left corner of the spectral display This keeps track of how many sweeps are included...

Page 20: ...trace Ex Office A At this point walk into Office B to collect a Peak Trace using the same steps as above It is important to clear the Peak Trace in Office B to ensure that no signal levels from Offic...

Page 21: ...any additional traces can be opened Now we want to create a Math Trace from the two peak traces we just opened While still in the Traces Sub Menu press F4 or select Math from the Traces Sub Menu From...

Page 22: ...In the screen shot below the spectrum was zoomed down to a 3GHz window to see the areas of the spectrum that contain the greatest differences In this example there are clearly some differences and eac...

Page 23: ...the OK button Begin walking around the room carrying the OSCOR unit Observe the RSSI graph on the bottom portion of the display As you get closer to the transmitter the level of this graph will increa...

Page 24: ...wireless camera transmission in comparison to the normal Wi Fi traffic This procedure should also work for many more types of transmitters To view the video transmitter press the Sweep Analyze button...

Page 25: ...tery charger To charge the battery simply plug the supplied AC adaptor into the unit with the battery in the OSCOR unit Expected charge time is 1 5 hours expected run time is 3 hours Note It is recomm...

Page 26: ...ll automatically update the firmware on the MPP A dialog box will appear when the MPP is connected informing you that an MPP firmware update is required Press OK to begin the update and then follow an...

Page 27: ...ickly adjust the current date tap the month on the displayed calendar with the stylus and select the current month from the drop down list that appears Tap the year with the stylus and enter the curre...

Page 28: ...the front of the OSCOR unit Then press the following key sequence to store the current screen image SHIFT HELP If successful a Save Dialog box will open The currently selected media either compact fl...

Page 29: ...less than 32 GB when formatting Third party software does exist which will allow you to format a larger partition using FAT32 To assist with setting up large capacity drives the OSCOR unit features a...

Page 30: ...sk button is grayed out skip to the next step If a partition already exists on the device skip to step 6 5 Make sure that the device that you want to format is still selected Press Create Partition In...

Page 31: ...y of the settings on your OSCOR unit such as trace colors or preset spans it is possible to reset the unit to the default conditions shipped from the factory To reset to factory defaults 1 From the Ma...

Page 32: ...kHz to 3 GHz o 8 GHz The tuner will sweep from 100 kHz to 8 GHz available on 24 GHz models o FM The tuner will sweep the FM radio broadcast band from just below 87 5 MHz to 108 MHz To change the tuner...

Page 33: ...the highlighted custom span Delete Deletes the highlighted custom span Import Imports user spans from a previously exported user spans file Export Exports current user spans including any custom spans...

Page 34: ...that have occurred since the last screen update A sweep count of 582 282 for a peak trace indicates that there are 582 282 sweeps of the spectrum included in that peak trace A peak trace will continue...

Page 35: ...pre amp see Using the Built in Pre Amp below 4 To turn off the RF attenuator select 0 dB Using the Built in Pre Amp In certain situations when dealing with low level signals which are partially obscur...

Page 36: ...from the Setup Sub Menu When the background of the Aux RF icon is orange the 0 8 GHz Auxiliary RF input is active When the background of the Aux RF icon is gray the 0 8 GHz Antenna input is active 4 T...

Page 37: ...Mode Indicator indicates current mode 2 Spectral Parameters Start Stop Center Span these parameters display information pertaining to the frequency range that is being scanned by the OSCOR s tuner 3 R...

Page 38: ...a time This can be accomplished by using one of several available methods Center on Cursor If your spectral display is not currently set to maximum span and your cursor is not at the center of the sp...

Page 39: ...lf of the current value until the minimum span is reached Expand key Pressing the EXPAND key will increase or expand the size of the displayed span by a factor of two until the maximum span is reached...

Page 40: ...t wish to change the cursor position Select the cursor value at the top center of the screen with the stylus so that it is highlighted Using the number keypad on the OSCOR unit enter the desired value...

Page 41: ...races 1 From the Main Menu select Traces or press F2 2 Select the desired trace icon i e Realtime Peak Average etc from the Displayed Sub menu to turn off or on Note If the Peak or Realtime trace view...

Page 42: ...cy Hopping Spread Spectrum or Burst Bugs For this reason the OSCOR was designed with a Peak Trace Display Mode In this mode the OSCOR will display the peak signal that occurs at each frequency as it c...

Page 43: ...the dialog box that appears navigate to any attached storage such as a compact flash card or a USB thumb drive select a saved peak trace and choose OK 4 The trace will be opened in the Empty 1 space...

Page 44: ...erage trace 1 From the Main Menu select Traces or press F2 2 From the Traces Sub Menu select Peak Avg or press F2 3 Select the Average icon An average trace will be displayed Several other tasks relat...

Page 45: ...it is not select Displayed or press F1 3 From the Displayed Sub Menu select the Persistence icon The Persistence view will be displayed Note For optimal performance it is recommended that the display...

Page 46: ...s 1 Select Merge Peak from the Traces Stored Sub Menu 2 Select the stored traces to be merged After a few seconds the merged trace will be listed as Unsaved Use the Save icon found in the Traces Store...

Page 47: ...Traces A Note Regarding Noise Floor Levels Peak Traces will tend to have a higher perceived noise floor because the highest peak at each point along a trace is stored and anything else is ignored unt...

Page 48: ...h refresh of the display however in order to fit the entire spectrum on the display each pixel will begin to represent a larger bandwidth as much as 30 MHz at the maximum span on a 24 GHz model All of...

Page 49: ...isticated transmitters that are not continuous transmitters This mode is useful to determine the location of a transmitter within an environment by comparing the RF spectrum of one room to another roo...

Page 50: ...can be performed from the Traces Math Sub Menu Math Once a math trace has been set up pressing the Math icon again will hide the math trace Each subsequent press of the Math icon will toggle the displ...

Page 51: ...als into one signal with a larger bandwidth Mask Example Detecting the presence of a cell phone call Edit Once a math trace has been set up use the Edit icon to change what traces are used in the Math...

Page 52: ...data for the full range but you want to look at just a specific portion of the spectrum in more detail In this situation you would use the Detail Zoom feature on the OSCOR To enable Detail Zoom on th...

Page 53: ...gion or highlighted portion of the spectral thumbnail with the stylus or your finger and dragging the highlighted portion to the left or right Setting Up the Tuner Range for Detail Zoom The tuner rang...

Page 54: ...RATION 47 To create a new preset span for the detail zoom tuner setting you must first create a new custom tuner span see page 26 Note Detail Zoom can also be accessed from the Traces Displayed Sub Me...

Page 55: ...e signal list parameters that are automatically identified by this functionality include Frequency Peak of the signal within the measured bandwidth window dBm Signal Level in dBm Bandwidth The measure...

Page 56: ...with a small square marker in the spectral display 7 From the Lists Sub Menu select the Save icon From the Save Dialog Box select a location and name for the saved signal list Select OK or press F5 S...

Page 57: ...list Note The frequency allocation information is provided as reference from the International Telecommunication Union ITU database per their band assignments It should not be used to determine if a s...

Page 58: ...ield may not be accurate for your region It is possible to redo the frequency information for your region after a signal list is generated without having to regenerate the signal list again 1 Ensure t...

Page 59: ...u must be careful with this function because it is relatively easy to corrupt a signal list with duplicates of the same signals 1 Open one of the signal lists that you would like to merge 2 If you are...

Page 60: ...moved 8 When you are finished editing your signal list be sure to save it if you want to be able to recall it later Editing Signals Additional information can be stored with each signal in your signal...

Page 61: ...the signal list A signal list can be hidden without being saved Ensure any signal list that is hidden is saved before shutting down the unit or the data from the signal list could be lost The tab pan...

Page 62: ...finger to highlight the signal you want to edit 2 Press the OK button 3 Select Go To Signal from the context menu that appears Notes The info bar at the bottom of the signal list displays the file pa...

Page 63: ...unction will make a determination of whether or not the demodulated audio from the signal correlates with room audio If it does it will add this information to the Threat column in the signal list A m...

Page 64: ...to make correlation determinations The following options are available from the drop down box 1 second 3 seconds and 5 seconds The longer the dwell time is the more accurate the correlation determina...

Page 65: ...2nd part of the process a correlation graph will be displayed at the top right corner of the screen If a signal does correlate with room audio then the text Correlates is added to the Threat field for...

Page 66: ...he Show icon A Live Raster Waterfall window will be displayed and you will begin to see traces displayed as they are captured in a waterfall format 4 To clear the waterfall display from the Live Raste...

Page 67: ...om a Live Raster Waterfall can be viewed full screen 1 While the Live Raster Waterfall is displayed and collecting date select the Full Screen icon from the Live Raster Sub Menu 2 To close the full sc...

Page 68: ...controls for selecting colors The slider to the far left is used to select a hue The color field to the right of the hue slider is for adjusting the saturation and brightness of the selected hue On t...

Page 69: ...p or down the gradient editor to modify the dBm value represented by the color To edit the color of the selected marker use the color controls on the left side of the dialog box 5 To return to the def...

Page 70: ...rs that there are many signals in the area around this frequency however these are false spurs and are due to the receiver overload condition The red yellow bars in the row above the spectrum are indi...

Page 71: ...ation applied The overload indicators have disappeared as well as the false spurs Overload information is stored when peak traces are saved The screen shot above shows a blue bar above the spectrum to...

Page 72: ...ee page 33 2 Press the SWEEP ANALYZE button 3 The OSCOR unit will enter Analyze Mode Note Analyze Mode can also be entered by using the Analyze icon found in Sweep Mode s Signals Signals menu Analyze...

Page 73: ...s to display a drop down list with possible values You can also use the rotary dial to scroll through possible values once the DIV indicator is highlighted Notes To reset the reference level and the d...

Page 74: ...Sub menu select the Video icon to change the demodulation scheme b The OSCOR will automatically determine the video format of the signal that it is tuned to It has the capability of decoding most var...

Page 75: ...cope view for subcarrier demodulation see page 72 3 From the Scope Sub Menu select the Demod Scope icon to toggle the display of the oscilloscope view 4 From the Scope Sub Menu select the Untrig Roll...

Page 76: ...ty of recording demodulated audio as a wav file for later playback or for analysis on another piece of equipment such as a PC To capture demodulated audio using Quick Record Quick Record enables the u...

Page 77: ...rom the Demod Capture Sub menu select the Play Audio icon 2 In the dialog box that appears select an audio file for playback and press OK 3 The audio file will begin playback During playback the Play...

Page 78: ...and a peak trace The real time trace is displayed in yellow the average trace in blue and the peak trace in red Observing all three traces together will help with signal analysis and will aid in catc...

Page 79: ...ignal In order to demodulate a subcarrier you must already be tuned to and demodulating a main carrier 2 From the Analyze Mode Menu select Demod or press F1 to enter the Demod Sub menu 3 From the Demo...

Page 80: ...tylus or your finger to select it Once this window has focus you can use the rotary knob to tune the subcarrier cursor or type in a value using the numeric keypad To adjust the main carrier frequency...

Page 81: ...rier Scope Display 1 From the Demod Scope Sub Menu select the Untrig Roll icon on the right side of the sub menu to change the subcarrier scope trigger With each press of the Untrig Roll icon the unit...

Page 82: ...al to the signal list at the cursor s current position If a signal list is already open the signal will be added to this list If no signal list is open a new list will be created with this signal adde...

Page 83: ...Corr Locate or press F4 4 The RSSI Sub Menu should be visible If it is not select RSSI or press F1 5 From the RSSI Sub Menu select the RSSI Level icon An RSSI graph displaying the RSSI level of the si...

Page 84: ...use the correlation function 1 Ensure that the audio from the OSCOR unit is muted If the demodulated audio is playing from the OSCOR unit s speakers it will be picked up by the OSCOR s microphone whic...

Page 85: ...lation graph and make a determination regarding whether or not the demodulated audio correlates with the ambient room noise The unit s determination is displayed on the top left hand side of the corre...

Page 86: ...l see page 76 or RF mapping a process taught in REI s TSCM training classes Contact REI sales reiusa net for training dates Ranging The ranging function uses a sound source and the speed of sound to c...

Page 87: ...n graph to see more detail To zoom in select a smaller distance 5 The OSCOR unit will automatically detect which peak is the generated white noise and display the distance to the eavesdropping device...

Page 88: ...tifying signals on the IF port the IF Out Frequency of the current cursor position is displayed in Analyze Mode To turn the IF Out display off or on 1 From the Analyze Mode Menu select Display or pres...

Page 89: ...select the Lock Cursor icon to lock the cursor for the main carrier Deselect the Lock Cursor icon to unlock the cursor Receiver Overload Analyze Mode Just as with sweep mode a receiver overload condi...

Page 90: ...an overload condition creating several false spurs and causing the Input Overload indicator to appear on the spectrum Applying just 10dB of input attenuation has eliminated the overload condition The...

Page 91: ...hoto sensors Sensor Antenna Frequency Range Wavelength Range Coax In Line Single Ended 5 MHz 2 GHz Not Applicable CCP Carrier Current 50 kHz 150 MHz Not Applicable VLF Loop Antenna 20 kHz 20 MHz Not A...

Page 92: ...d with an MPP icon Also a tabbed panel will be added displaying options for all of the inputs Notes If you select No when prompted to switch inputs to the MPP the OSCOR unit will continue to use the b...

Page 93: ...oom and generate a signal list If a signal is detected you can go to analyze mode and even demodulate any analog signals that might be present Caution Switching between MPP inputs will clear the peak...

Page 94: ...from either the port A or port B side of the coax without having to physically switch the cables on the inputs To use the Coax In Line Input 1 If making an in line measurement on the coax cable from a...

Page 95: ...ore moving on to the next step While still in the Peak Avg Sub Menu select the Clear Peak icon 7 On the options panel of the MPP tab select Port B as the input port Observe any signals present on Port...

Page 96: ...ared to identify possible suspect signals A math trace can also be performed on these two peaks see page 42 Notes Always verify the directionality of any suspicious signal by connecting each side up i...

Page 97: ...gnal in the 5 MHz to 2 GHz range may be connected to these inputs for measurement Adapters may be necessary to connect to the F type connectors Adapters are not included as part of the OSCOR Unit The...

Page 98: ...f this voltage exceeds 250 volts do not test with the MPP To measure carrier current with the MPP 1 Ensure that the battery level of the OSCOR is enough to power the unit 2 Remove the power cord from...

Page 99: ...nt measurements Be sure that the AC power supply for the OSCOR unit is not plugged into the electrical circuit that you are testing for carrier currents Be aware that any switching power supply connec...

Page 100: ...ically is a lot of RF emissions at the low end of the spectrum This RF energy can cause the OSCOR to display the Input Overload warning This can occur especially if the preamp is turned ON The tuner o...

Page 101: ...oop Antenna input is selected Notes The displayed frequency range in Sweep Mode for the VLF antenna is from 50 kHz to 20 MHz To evaluate signals down to 20 kHz switch to analyze mode The 100 MHz Baseb...

Page 102: ...ard any suspected IR source Notes Infrared signals must be line of sight between the MPP and either the infrared transmitter or a reflection from the transmitter For best results in locating transmitt...

Page 103: ...ible Light input is selected 2 The Visible Light detector is located on the end of the MPP with the Photo Detector label Point this end toward any suspected visible light transmitter Notes For best re...

Page 104: ...o 120MHz This can be very helpful in analyzing baseband signals Because of the improved resolution bandwidth in Analyze Mode it is better to evaluate baseband signals in Analyze Mode Disabling Disconn...

Page 105: ...ck and the 0 8 GHz auxiliary jack on the back of the OSCOR unit 2 Upon disconnecting the MPP from the AUX jack you will be presented with a dialog box 3 Select Yes or press F5 to close the MPP tab and...

Page 106: ...included Built in Speakers VIDEO SYSTEM Formats NTSC PAL SECAM Demodulation AM FM Filter Sizes 12 75 MHz 6 375 MHz Subcarrier Filters 6 25 kHz 12 5 kHz 200 kHz ANTENNA SYSTEM Built in Auto Switching...

Page 107: ...ith Battery 9 6lbs 4 4 kg Case Dimensions 5 5 in x 14 9 in x 19 5 in 14 cm x 37 8cm x 49 5cm Loaded Case Weight 21 0 lbs 9 5kg Operating Temperature 0 C to 50 C Note It is recommended to run the unit...

Page 108: ...isplay the Trace Record Waterfall is stored as raw binary trace data all of the trace information is available for later analysis During the Trace Record all of the collected trace information includi...

Page 109: ...record waterfall can quickly consume a lot of storage space As you adjust the interval and total time for your trace record waterfall the information at the bottom of the dialog box will display the n...

Page 110: ...Location select a location either a USB flash drive or compact flash card and type a file name for the stored waterfall file 5 Select OK in the dialog box to begin the recording 6 During recording no...

Page 111: ...with the stylus or your finger Once the trace cursor is active the rotary knob will move the cursor along the trace in the spectral display To make the waterfall cursor active tap the waterfall displ...

Page 112: ...select Back or press F6 to return to Sweep Mode Modifying the Trace Record Waterfall Color Gradient The Color Gradient for the Trace Record Waterfall can be customized just like the color gradient for...

Page 113: ...t rid of the overload indicators and any false spurs then try 20 dB and then 30 dB The screenshot above shows an overload condition occurring while capturing a Trace Record Waterfall As a result of th...

Page 114: ...strong signal which was present while the Trace Record Waterfall was being captured caused an overload condition to occur The red bar to the left of the waterfall image indicates the traces which con...

Page 115: ...tting signal on off such as a cell phone or a baby monitor during the waterfall recording Press the Power button to turn the unit on Press F4 or select Waterfall from the main menu Press F2 or select...

Page 116: ...be saved to your selected media and will be available for review after the recording is finished The Trace Record Sub Menu will still be visible Select the Review icon A dialog box will open up Make s...

Page 117: ...ng and dragging with the stylus or by pressing the arrow keys You can also zoom in and out on the waterfall data by pressing the Narrow and Expand buttons By scrolling through the waterfall data using...

Page 118: ...to a peak trace taken during the same period as the waterfall recording With the peak trace it is also easy to see the frequency hopper at approximately 778 MHz and the burst transmitter at 2 6 GHz h...

Page 119: ...this license which gives you legal permission to copy distribute and or modify the software Also for each author s protection and ours we want to make certain that everyone understands that there is n...

Page 120: ...wing a Accompany it with the complete corresponding machine readable source code which must be distributed under the terms of Sections 1 and 2 above on a medium customarily used for software interchan...

Page 121: ...distribution limitation excluding those countries so that distribution is permitted only in or among countries not thus excluded In such case this License incorporates the limitation as if written in...

Page 122: ...APPENDIX A15...

Page 123: ...U S A 800 824 3190 US Only 1 931 537 6032 www reiusa net Copyright Research Electronics International LLC This manual contains proprietary information intended solely for use with the OSCOR Spectrum A...

Reviews: